Earth and Space Sciences Regents, August 2026, question 17
Tap an image to open it full size.
What the figure shows
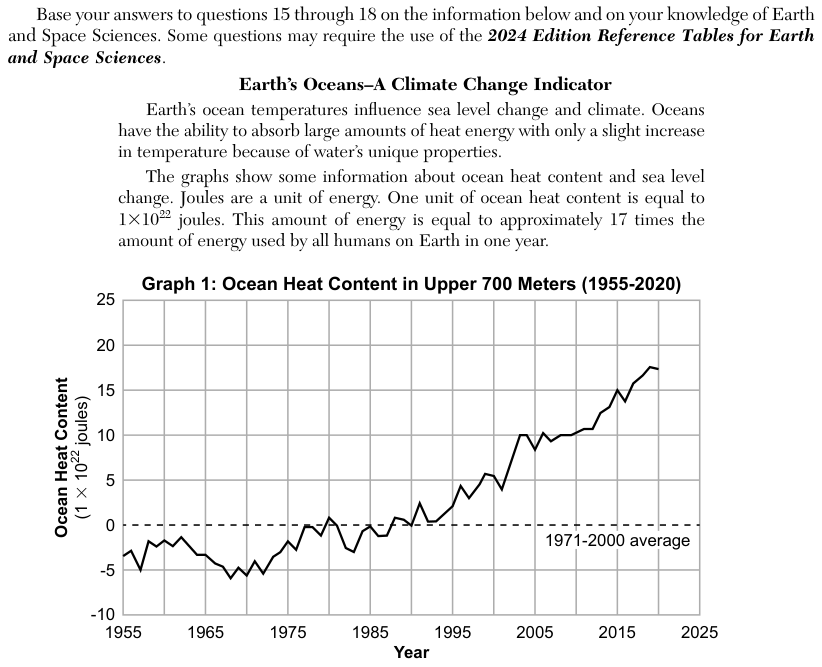
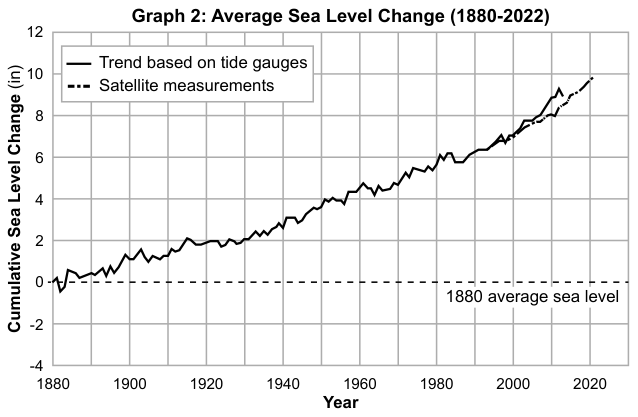
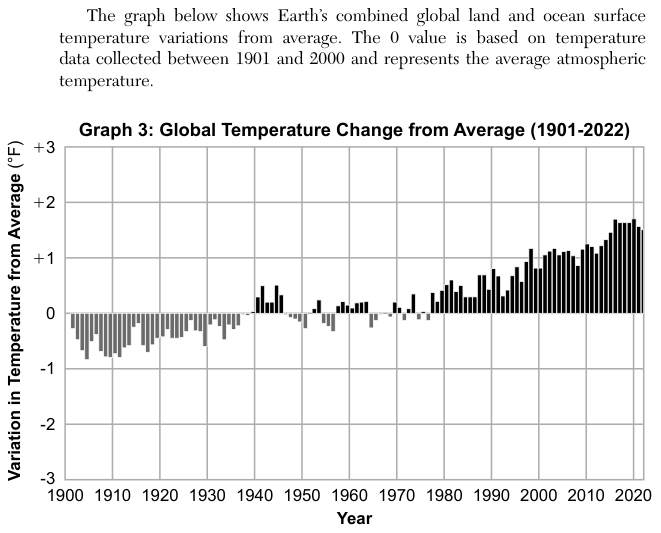
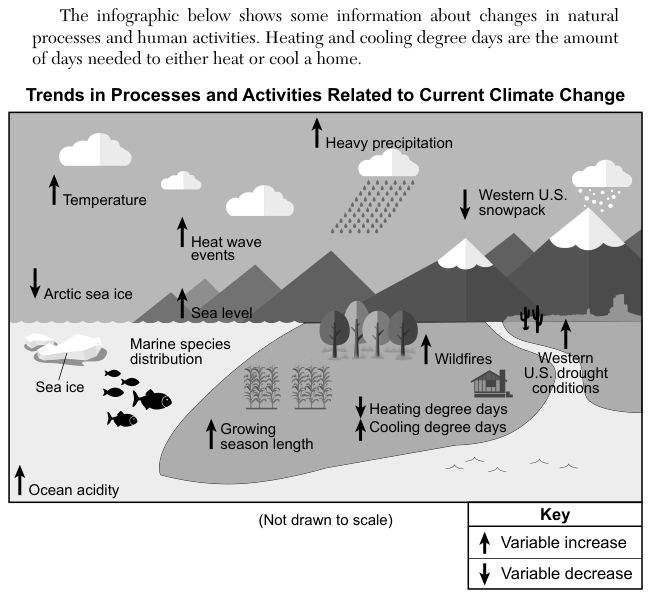
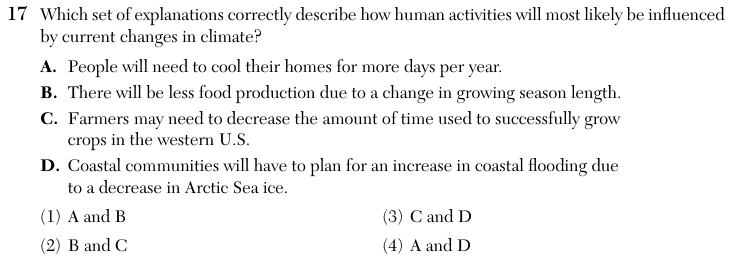
An infographic titled Trends in Processes and Activities Related to Current Climate Change uses up arrows for an increase and down arrows for a decrease. It shows increases in temperature, heavy precipitation, heat wave events, sea level, wildfires, Western United States (U.S.) drought conditions, growing season length, cooling degree days and ocean acidity, and decreases in Arctic sea ice, Western U.S. snowpack and heating degree days; marine species distribution is shown without an arrow. The passage defines heating and cooling degree days as the amount of days needed to heat or cool a home. Graphs 1 to 3 show ocean heat content, sea level and global temperature all rising over time. The question lists four statements, A to D, about how human activities may be affected.
How to think about it
Test each statement A to D on its own against the arrows on the infographic. Check whether the statement's direction (more or less, increase or decrease) matches the arrow for the variable it names. Only then look for the answer choice that pairs the two statements that both pass.
Which set of explanations correctly describe how human activities will most likely be influenced by current changes in climate? A. People will need to cool their homes for more days per year. B. There will be less food production due to a change in growing season length. C. Farmers may need to decrease the amount of time used to successfully grow crops in the western U.S. D. Coastal communities will have to plan for an increase in coastal flooding due to a decrease in Arctic Sea ice.
Choice 4 is right. Statement A matches the infographic. Cooling degree days measure how much and how often the temperature rises above a reference temperature, so they add up the demand for cooling; they are not a simple count of the days a home needs cooling. They are increasing, so people will need to cool their homes more each year. Statement D matches the rising sea level shown on the infographic and in Graph 2, and higher seas bring more coastal flooding. However, the cause D gives is loosely worded. Arctic sea ice already floats, so its melting adds almost nothing to sea level; seas rise mainly because warming water expands and because ice on land melts. A and D is still the only pair with no statement that contradicts the infographic.
Statement A is supported, but statement B is not. The infographic shows the growing season getting longer, which does not by itself mean less food production. B may come from reading a change in season length as a loss.
Neither statement is supported. The growing season length arrow points up, so B's claim of less food and C's claim of a shorter growing time both run against it. C may come from linking the Western U.S. drought arrow to growing time, but drought is a different variable from season length.
Statement C is not supported. The infographic shows growing season length increasing, so farmers would have more time to grow crops, not less. Statement D's cause is wrong, because melting sea ice that already floats does not raise sea level. A and D is still the keyed pair, because B and C contradict the infographic.