Earth and Space Sciences Regents, August 2026, question 15
Tap an image to open it full size.
What the figure shows
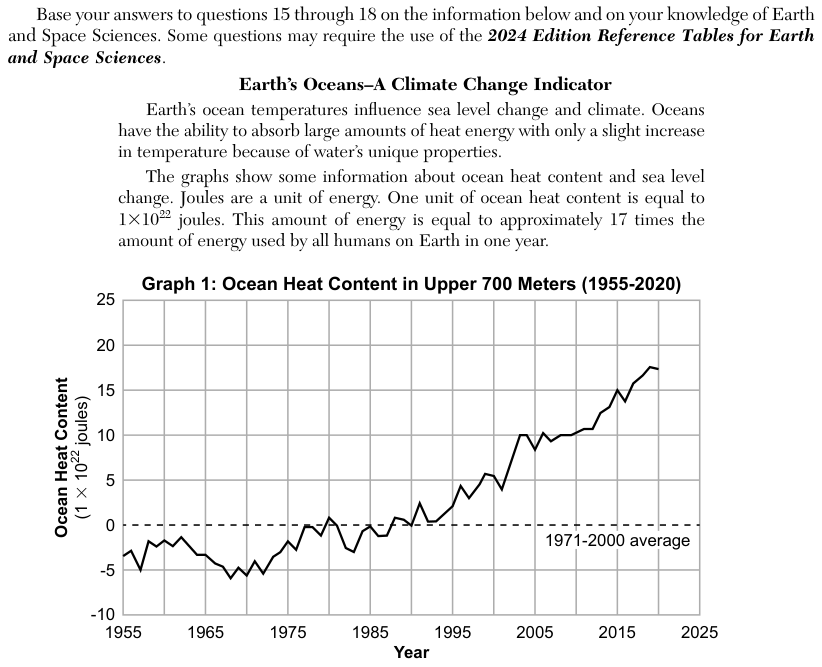
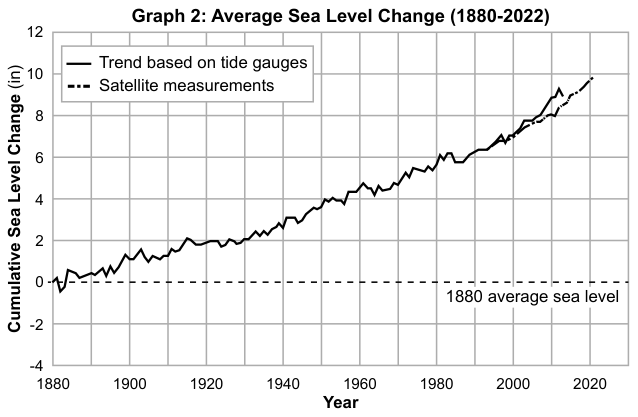
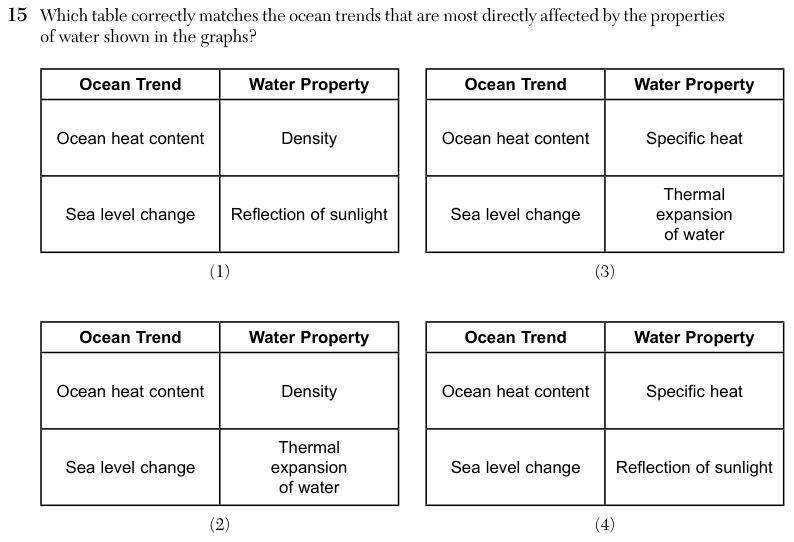
The passage says oceans can absorb large amounts of heat energy with only a slight rise in temperature because of the unique properties of water. Graph 1, Ocean Heat Content in Upper 700 Meters (1955-2020), plots ocean heat content in units of 1 x 10^22 joules against year, with a dashed line for the 1971-2000 average; the line runs from about -3 in 1955 to about 17 in 2020. Graph 2, Average Sea Level Change (1880-2022), plots cumulative sea level change in inches against year, from 0 in 1880 to nearly 10 in 2022, using tide gauges and later satellite measurements. Each of the four answer choices is a two-row table pairing an ocean trend with a water property: (1) ocean heat content with density, sea level change with reflection of sunlight; (2) ocean heat content with density, sea level change with thermal expansion of water; (3) ocean heat content with specific heat, sea level change with thermal expansion of water; (4) ocean heat content with specific heat, sea level change with reflection of sunlight.
How to think about it
Take each trend in turn and ask what happens to water as it gains heat. Read what the passage says about how oceans absorb heat, and read the trend in each graph. Then check each row of a choice table: does the water property named there link to the trend in that row?
Which table correctly matches the ocean trends that are most directly affected by the properties of water shown in the graphs? Ocean Trend Water Property Ocean Trend Water Property Ocean heat content Density Ocean heat content Specific heat Sea level change Reflection of sunlight Sea level change Thermal expansion of water