Earth and Space Sciences Regents, August 2026, question 18
Tap an image to open it full size.
What the figure shows
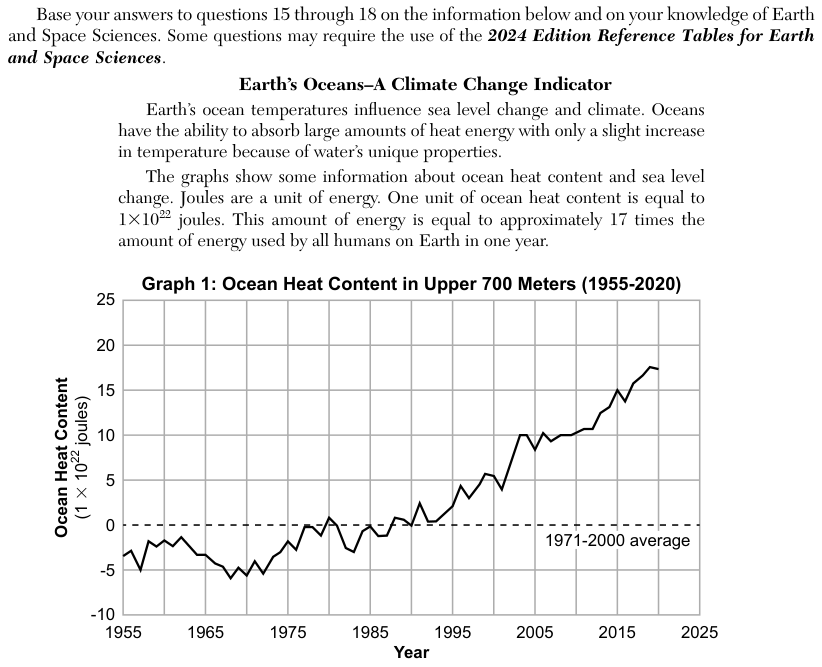
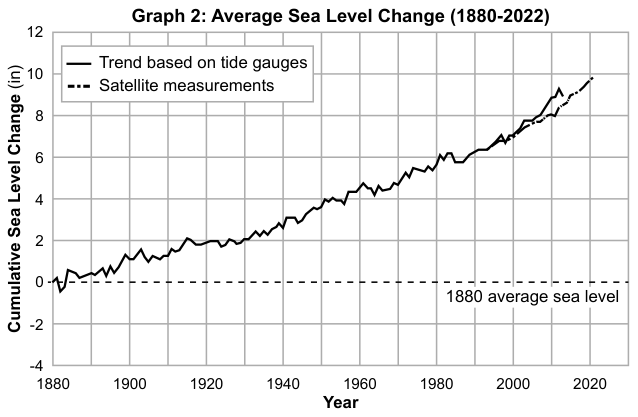
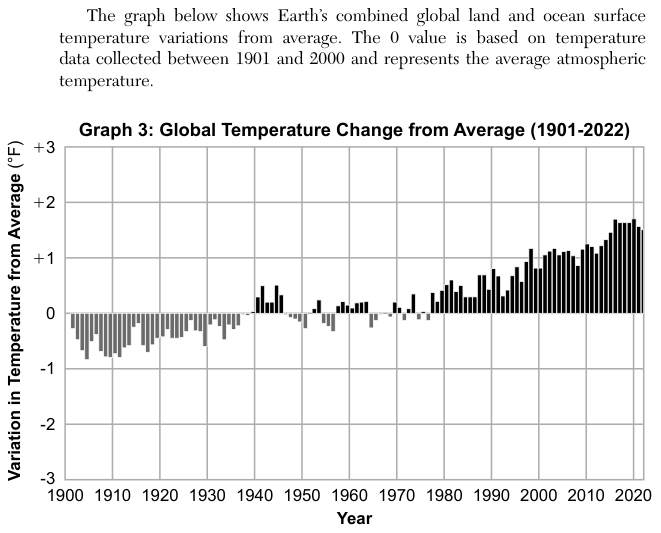
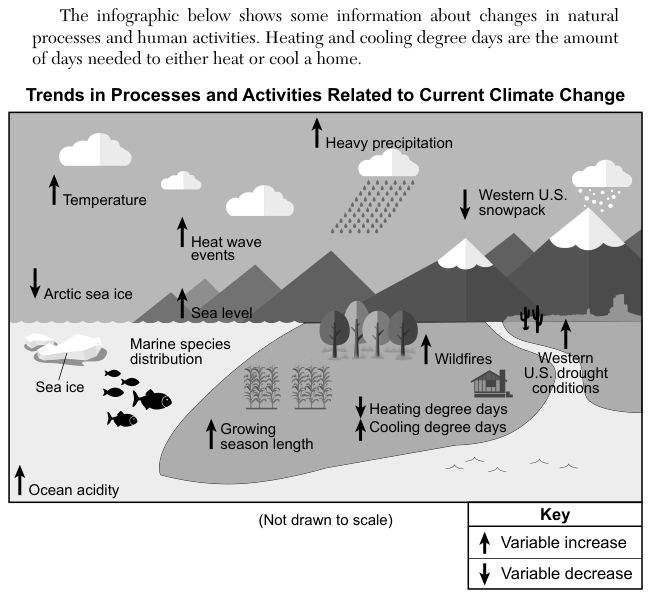
The passage says oceans absorb large amounts of heat energy. Graph 1 shows ocean heat content in the upper 700 meters rising from about -3 to about 17 units of 1 x 10^22 joules between 1955 and 2020; Graph 2 shows sea level rising since 1880; Graph 3 shows global temperature above the 1901-2000 average in recent decades, by about +1.5 to +1.7 degrees Fahrenheit (°F) between 2015 and 2022. The infographic Trends in Processes and Activities Related to Current Climate Change shows up arrows (increase) for temperature, heat wave events, sea level, wildfires, ocean acidity and other variables, and a down arrow (decrease) for Arctic sea ice. Marine species distribution is shown without an arrow.
How to think about it
Decide first which way energy is moving in Earth's system as a result of human activity: into or out of the oceans and atmosphere. Use the graphs to check. Then, for each statement, compare the climate factor it names and the direction it gives with the arrows on the infographic, and watch for words that claim more than the information shows.
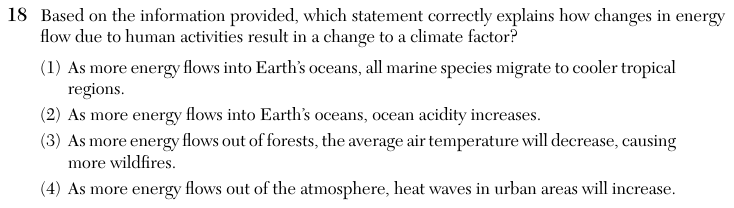
Based on the information provided, which statement correctly explains how changes in energy flow due to human activities result in a change to a climate factor?
Choice 2 is right. It is the only choice that fits both the graphs and the infographic: Graph 1 shows more energy flowing into the oceans, and the infographic shows ocean acidity increasing. However, the added heat is not what makes the ocean more acidic. Burning fossil fuels adds carbon dioxide to the air, and seawater absorbs some of it, which forms carbonic acid and raises ocean acidity. The same carbon dioxide traps more energy near Earth's surface, and the oceans take up much of that heat. Linking the acidity to a change in energy flow is how the question frames it, not the direct cause.
The infographic lists marine species distribution as a related trend, but nothing in it says that all species move. Tropical regions are also the warmest waters, not cooler ones, so this choice contradicts itself.
Graph 3 and the infographic show air temperature increasing, not decreasing. More wildfires go with warmer and drier conditions, so a falling temperature would not cause them.
The graphs show energy building up in Earth's system, not flowing out of the atmosphere. If more energy left the atmosphere, air would cool and heat waves would become less common, not more.