Earth and Space Sciences Regents, June 2026, question 8

Tap an image to open it full size.
What the figure shows
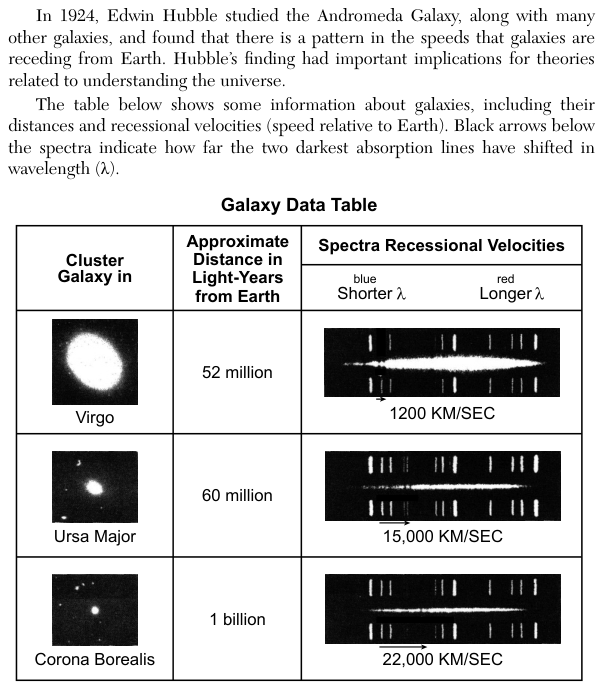
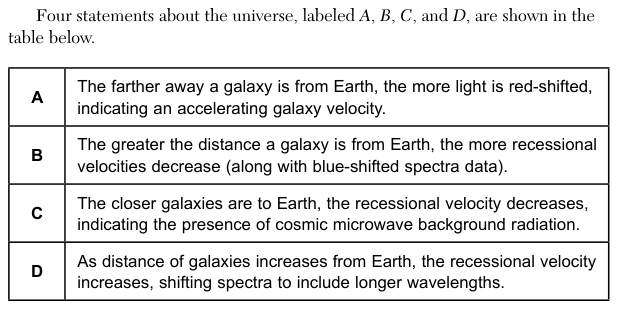
The passage says that in 1924 Edwin Hubble studied the Andromeda Galaxy and other galaxies and found a pattern in the speeds at which galaxies move away from Earth. The Galaxy Data Table gives, for a galaxy in each of three clusters, its distance in light-years, its spectrum with blue (shorter wavelength) on the left and red (longer wavelength) on the right, and its recessional velocity: Virgo, 52 million light-years, 1200 kilometers per second (km/s); Ursa Major, 60 million light-years, 15,000 km/s; Corona Borealis, 1 billion light-years, 22,000 km/s. A black arrow under each spectrum shows how far the two darkest absorption lines have shifted; every arrow points toward the red end, and the arrows are longer for the faster galaxies. Four statements follow. A: the farther away a galaxy is, the more its light is red-shifted, indicating an accelerating galaxy velocity. B: the greater the distance, the more recessional velocities decrease, with blue-shifted spectra. C: the closer galaxies are, the more recessional velocity decreases, indicating cosmic microwave background radiation. D: as distance increases, recessional velocity increases, shifting spectra to include longer wavelengths.
How to think about it
The Big Bang theory says the universe is expanding. Read the table from the nearest galaxy to the farthest and note how the velocity and the arrow under the spectrum change. Then check each statement against those trends, and also check whether the conclusion each statement draws can come from these data.
Which pair of statements supports the Big Bang theory, based on the given astronomical evidence of light spectra, galaxy distances, and galaxy velocities?