Earth and Space Sciences Regents, January 2026, question 25
Tap an image to open it full size.
What the figure shows
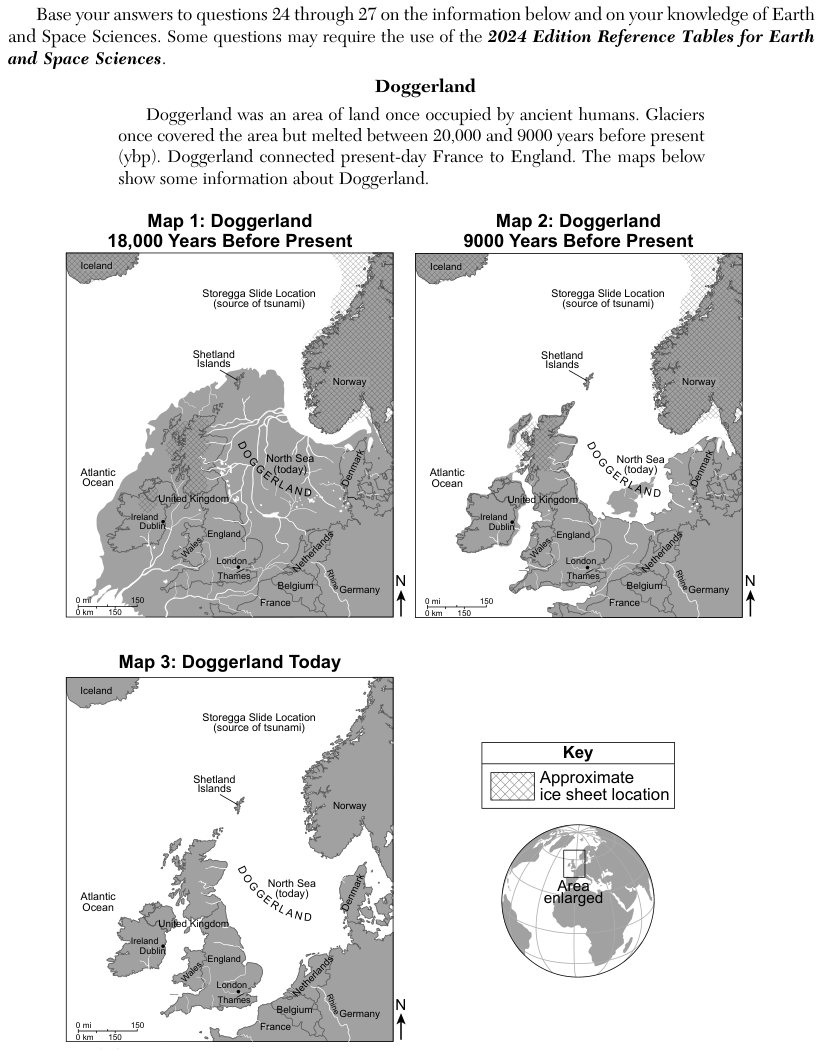
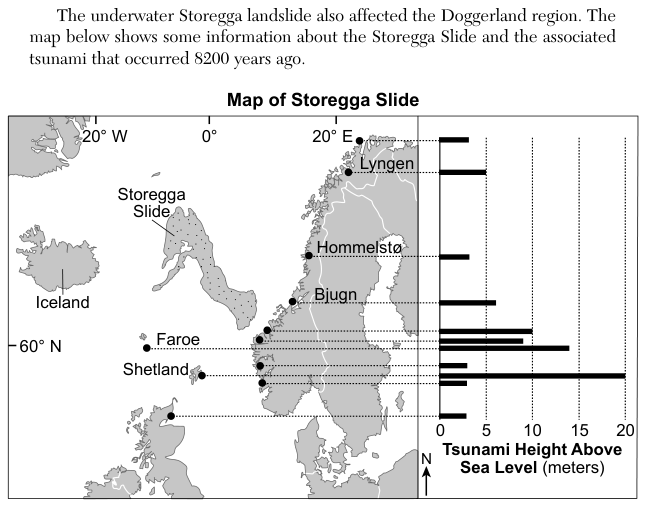
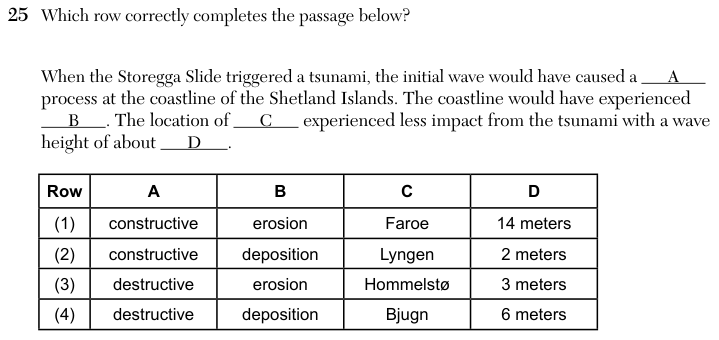
The Map of Storegga Slide shows the slide off the coast of Norway, with dots at coastal sites in Norway, the Faroe Islands, the Shetland Islands and Scotland. A bar graph beside the map gives Tsunami Height Above Sea Level in meters for each site, on a scale from 0 to 20. The bars read about 20 meters at Shetland, about 14 meters at Faroe, about 6 meters at Bjugn, about 5 meters at Lyngen and about 3 meters at Hommelstø. The question table has four rows completing a passage with a process type (A), a process (B), a location (C) and a wave height (D).
How to think about it
Find the Shetland bar on the graph and decide what a wave of that height does to a coastline: does it build the coast up or wear it down? For C and D, read the bar for each named location and check that the height given in a row matches the graph.
Which row correctly completes the passage below? When the Storegga Slide triggered a tsunami, the initial wave would have caused a A process at the coastline of the Shetland Islands. The coastline would have experienced B . The location of C experienced less impact from the tsunami with a wave height of about D . Row A B C D