Earth and Space Sciences Regents, January 2026, question 3
Tap an image to open it full size.
What the figure shows
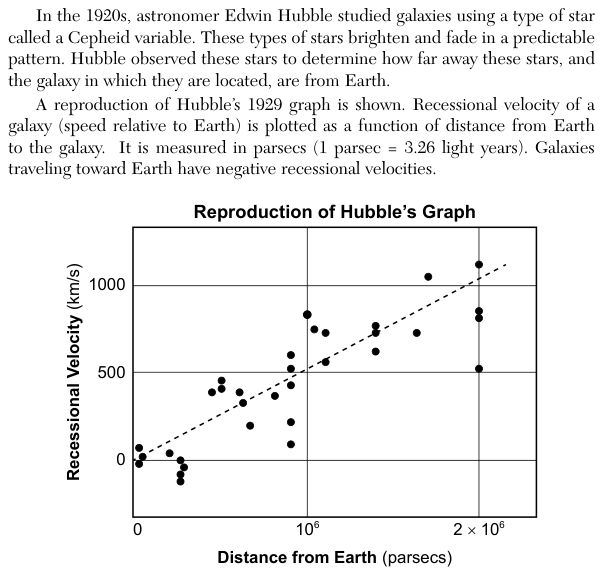
A reproduction of Hubble's 1929 graph plots recessional velocity (the speed of a galaxy relative to Earth) in kilometers per second (km/s) against distance from Earth in parsecs, from 0 to 2 x 10^6 parsecs. The passage says galaxies traveling toward Earth have negative recessional velocities. The points spread around a dashed straight line that rises from near 0 km/s close to Earth to about 1100 km/s at 2 x 10^6 parsecs. A few galaxies within about 0.3 x 10^6 parsecs of Earth plot below zero.
How to think about it
Look at the overall trend of the points and the dashed line, not at single points. Ask how recessional velocity changes as distance from Earth grows. Then ask what kind of universe would produce that pattern.
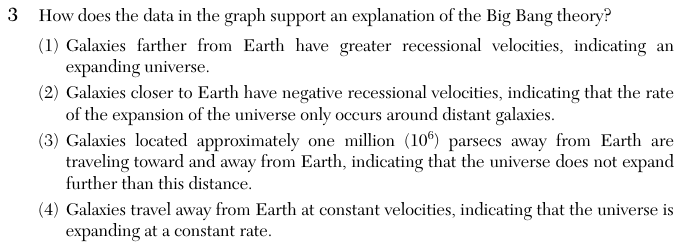
How does the data in the graph support an explanation of the Big Bang theory?
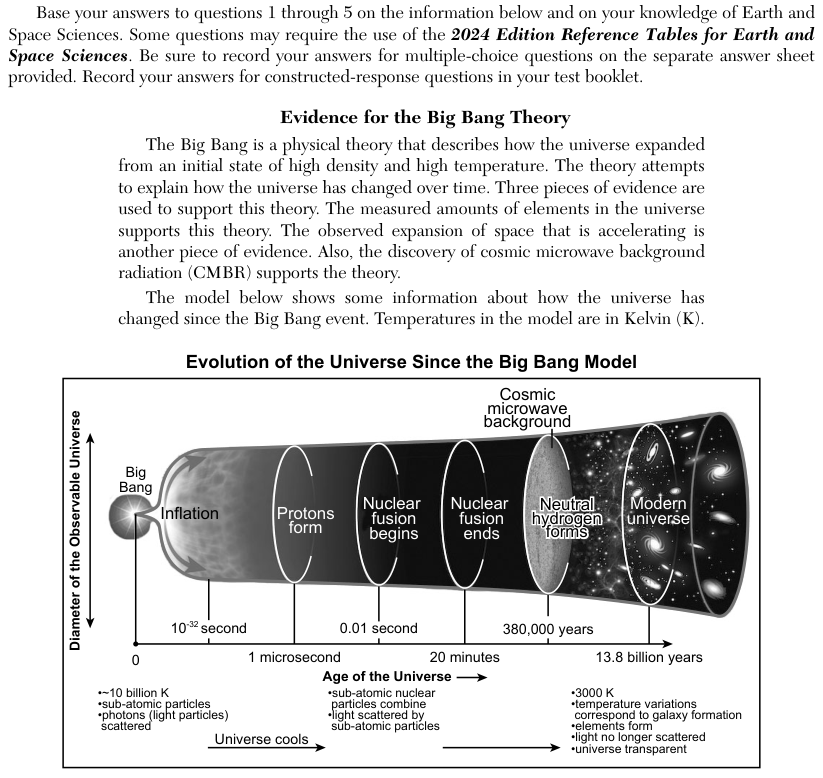
Choice 1 is right. The points and the dashed line rise steadily: galaxies farther from Earth move away faster. This is what happens when space itself is stretching everywhere, because more stretching builds up over a longer distance. An expanding universe is one of the pieces of evidence for the Big Bang theory.
Only a few nearby galaxies have negative values. They move toward Earth because of the pull of gravity between neighboring galaxies, which is larger than the small expansion speed at short distance. The graph shows the expansion growing with distance, not happening only far away.
At about 10^6 parsecs all the plotted galaxies have positive recessional velocities, so they are all moving away from Earth. The graph also shows galaxies out to 2 x 10^6 parsecs moving away even faster, so the expansion does not stop at 10^6 parsecs.
The galaxies do not all move at one constant speed: recessional velocity rises as distance rises. This choice may come from reading the straight dashed line as a constant speed, when it shows a constant ratio of speed to distance.