Earth and Space Sciences Regents, August 2025, question 15
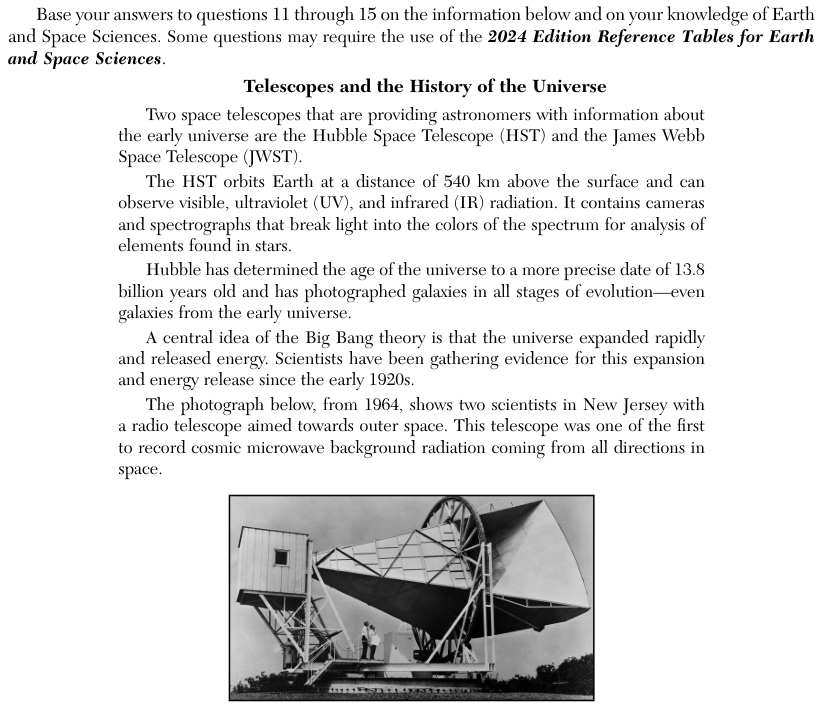
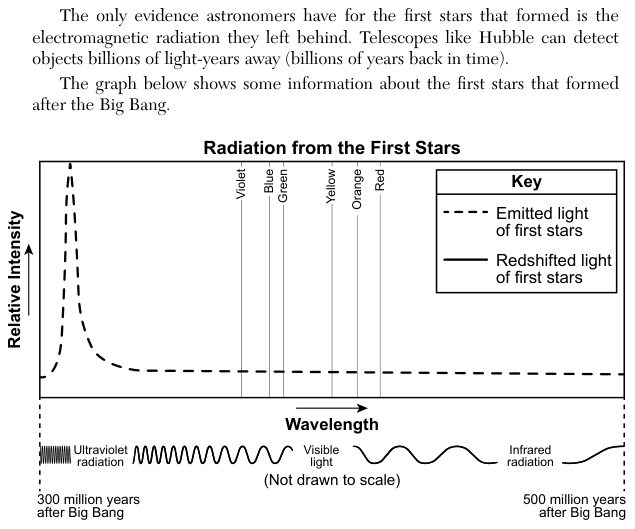
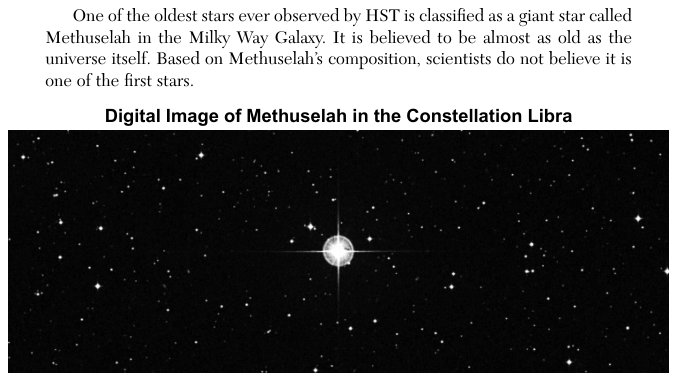
Tap an image to open it full size.
What the figure shows
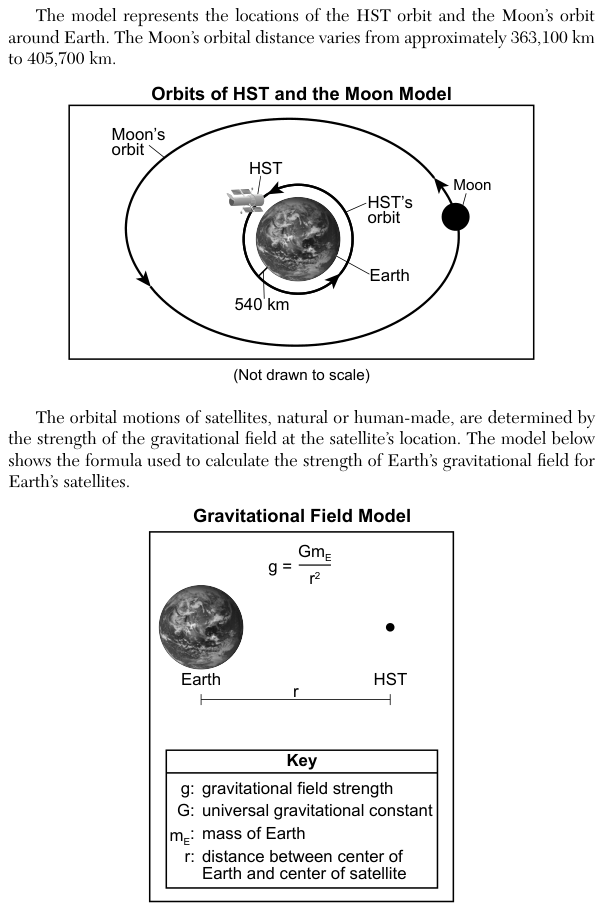
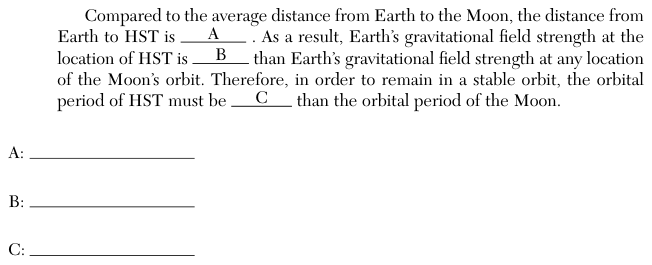
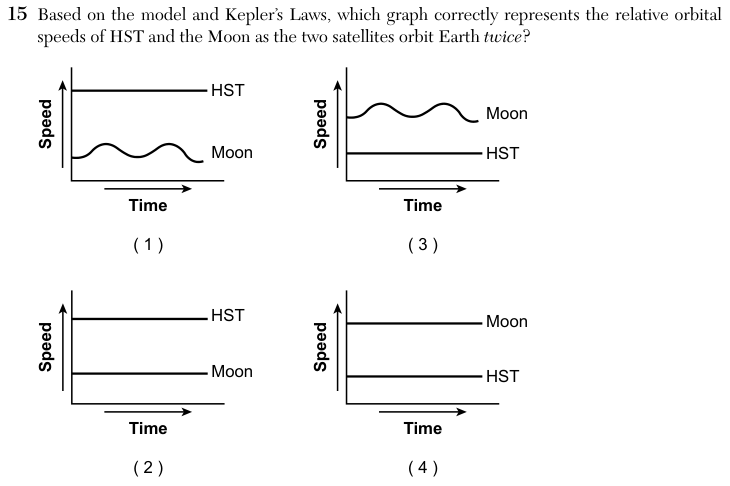
The Orbits of HST and the Moon Model (not drawn to scale) shows the Hubble Space Telescope (HST) on a small circular orbit 540 kilometers (km) above Earth and the Moon on a much larger oval orbit; the passage says the Moon's orbital distance varies from about 363,100 km to 405,700 km. A Gravitational Field Model gives g = Gm(E)/r squared, where g is gravitational field strength, G is the universal gravitational constant, m(E) is the mass of Earth and r is the distance between the center of Earth and the center of the satellite. The four answer choices are graphs of speed against time with two lines labeled HST and Moon. Graph 1: HST is a flat line near the top and Moon is a wavy line with two waves lower down. Graph 2: HST is a flat line near the top and Moon is a flat line lower down. Graph 3: Moon is a wavy line with two waves near the top and HST is a flat line lower down. Graph 4: Moon is a flat line near the top and HST is a flat line lower down.
How to think about it
Two features must match: which satellite is faster overall, and whether each satellite's speed changes during an orbit. For the first, use Kepler's third law and the gravitational field formula, and compare the distances of the two satellites from Earth. For the second, use Kepler's second law and look at the shape of each orbit in the model.
Based on the model and Kepler’s Laws, which graph correctly represents the relative orbital speeds of HST and the Moon as the two satellites orbit Earth twice? Speed Time