Earth and Space Sciences Regents, June 2025, question 14
Tap an image to open it full size.
What the figure shows
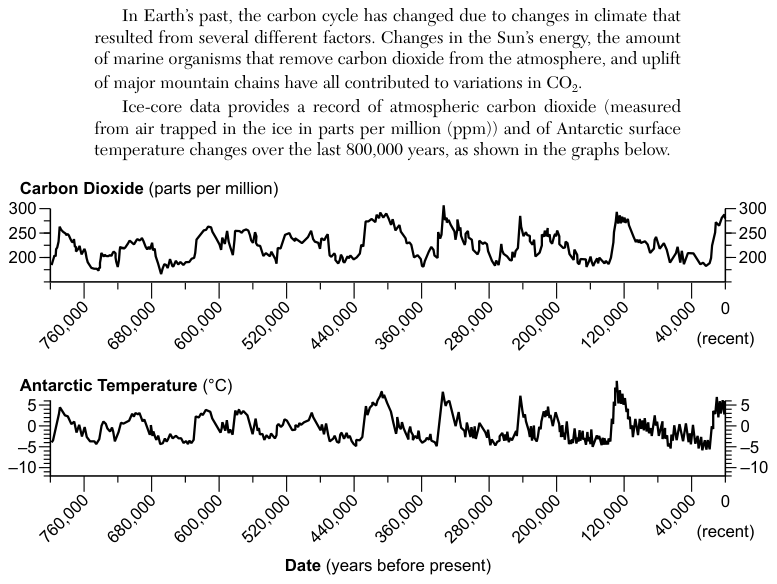
Two line graphs share the same time axis, the date in years before present, from about 800,000 years ago on the left to 0 (recent) on the right. The upper graph shows atmospheric carbon dioxide (CO2) in parts per million (ppm), from about 175 to 300 ppm, measured from air trapped in ice cores. The lower graph shows Antarctic surface temperature change in degrees Celsius (°C), from about -10 to +5 °C.
How to think about it
Pick any time where one line goes up or down, then look straight down or up at the other graph at the same date. Ask whether the two lines rise and fall together, move in opposite directions, or show no pattern. Do this at several dates, not only one.
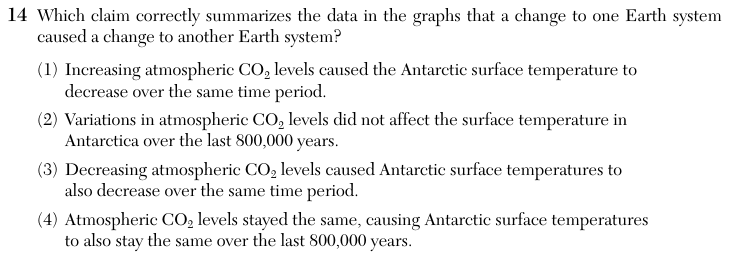
Which claim correctly summarizes the data in the graphs that a change to one Earth system caused a change to another Earth system?
Choice 3 is right. Across the whole 800,000-year record, the carbon dioxide line and the temperature line rise and fall together. Each time carbon dioxide drops, the Antarctic temperature drops at about the same time. This matches the idea that carbon dioxide in the atmosphere traps heat, so less carbon dioxide means a cooler surface.
This choice describes the two lines moving in opposite directions. The graphs show the opposite: when carbon dioxide increases, the temperature increases too.
This choice ignores the close match between the two graphs. The peaks and lows line up at the same dates, which shows a strong connection between carbon dioxide and temperature.
This choice misreads the graphs as flat. Carbon dioxide varied between about 175 and 300 ppm, and temperature varied by more than 10 °C over the period.