Earth and Space Sciences Regents, June 2025, question 7
Tap an image to open it full size.
What the figure shows
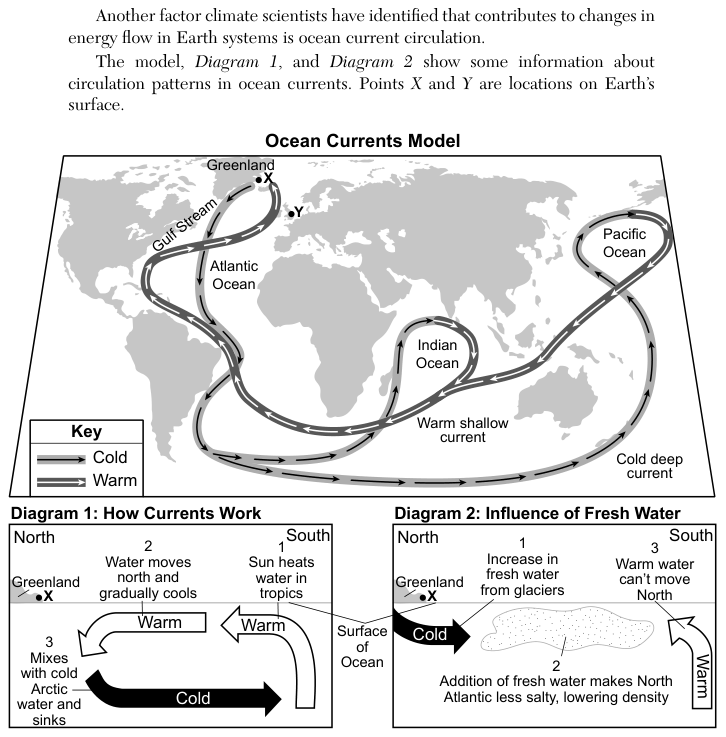
The "Ocean Currents Model" is a world map showing a loop of warm shallow currents and cold deep currents linking the Atlantic, Indian and Pacific Oceans. Point X is on the coast of Greenland. Diagram 1, "How Currents Work", shows the Sun heating water in the tropics, the warm water moving north and cooling, and then mixing with cold Arctic water and sinking to flow back south as a cold current. Diagram 2, "Influence of Fresh Water", shows an increase in fresh water from glaciers near X, which makes the North Atlantic less salty and lowers its density, and warm water that cannot move north.
How to think about it
Follow the steps in Diagram 1 to see what makes the current move: the cold water near Greenland has to sink. Then read Diagram 2 to see how fresh water from glaciers changes the density of that water. Ask how a change in density affects the sinking, and so the whole loop.
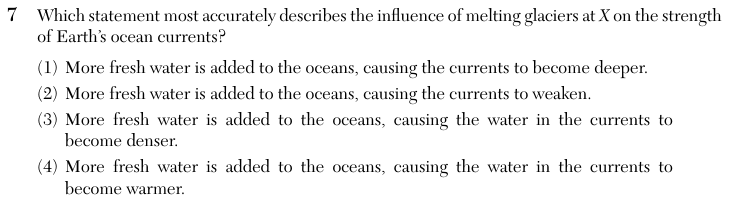
Which statement most accurately describes the influence of melting glaciers at X on the strength of Earth’s ocean currents?
Choice 2 is right. Meltwater from glaciers at X is fresh, so it lowers the salt content and the density of the North Atlantic surface water. Less dense water does not sink as easily, so less water sinks to form the cold deep current. With less sinking, the whole circulation slows, and Diagram 2 shows warm water no longer able to move as far north.
This choice comes from linking more water with deeper currents. Fresh water is less dense than salt water, so it stays near the surface and reduces sinking instead of making the currents go deeper.
This choice confuses the effect of salt with the effect of fresh water. Salt makes water denser, so adding fresh water makes the water less dense, as Diagram 2 states.
This choice may come from confusing the warm surface current at X with the effect of adding cold glacier meltwater. The meltwater changes the salinity and density of the water, not the warmth of the current. Diagram 2 also shows that warm water from the south can no longer move north, so less warm water reaches the North Atlantic.