Earth and Space Sciences Regents, August 2026, question 42
Tap an image to open it full size.
What the figure shows
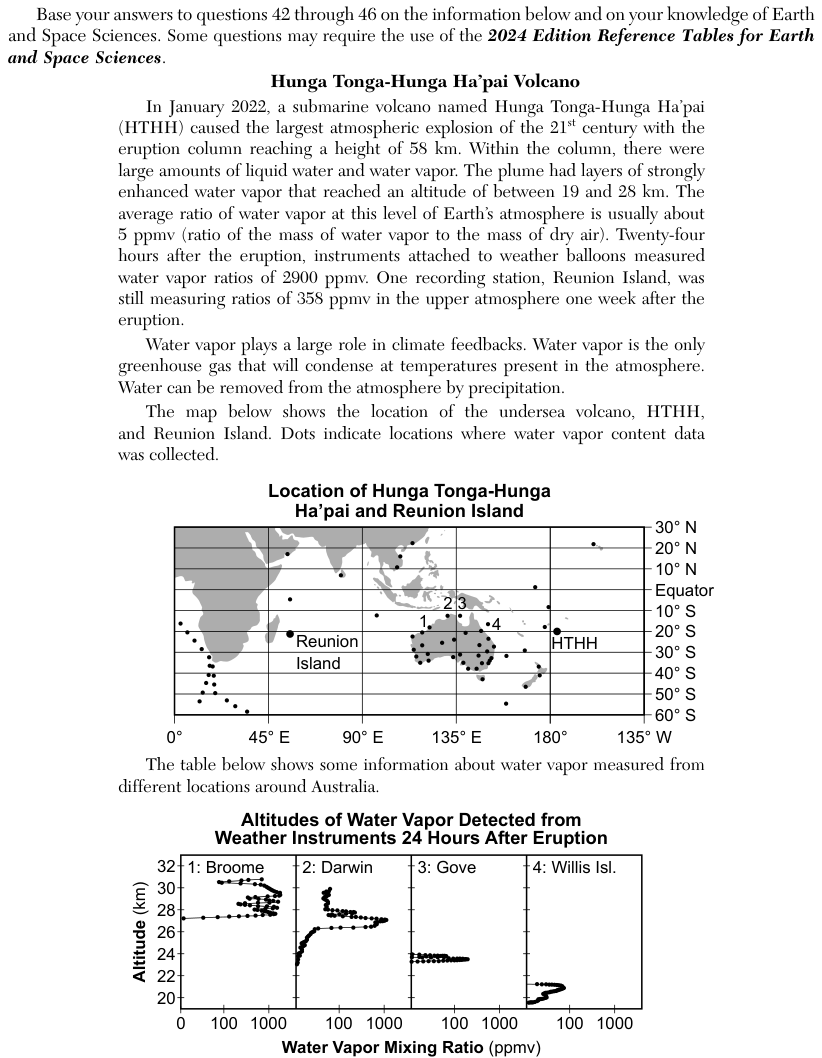
The passage describes the January 2022 eruption of the undersea volcano Hunga Tonga-Hunga Ha'apai (HTHH), whose column reached 58 kilometers (km) and carried layers of strongly enhanced water vapor between 19 and 28 km. The usual water vapor ratio at that level is about 5 parts per million by volume (ppmv). A set of four graphs, Altitudes of Water Vapor Detected from Weather Instruments 24 Hours After Eruption, plots altitude in km, from about 19 to 32 km, against the water vapor mixing ratio in ppmv on a scale marked 0, 100 and 1000. In the Location 2: Darwin graph, the points start near the left edge at about 23 km, curve slowly to the right up to about 26 km, jump far to the right to about 1000 ppmv at about 27 km, then move back to the left, near 100 ppmv or less, from about 28 to 30 km.
How to think about it
Use only the Location 2: Darwin graph. Read the vertical axis for altitude and the horizontal axis for the water vapor ratio, and note the printed labels on the horizontal axis: 0, 100 and 1000. Trace the line of points from bottom to top and watch whether the ratio keeps moving one way or changes direction.
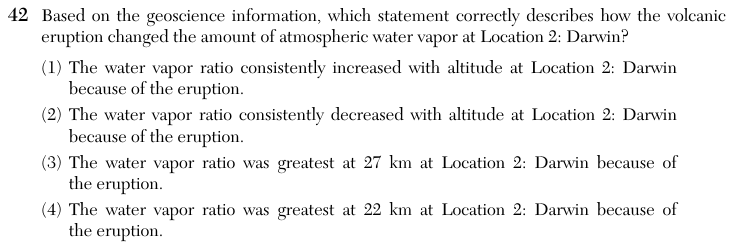
Based on the geoscience information, which statement correctly describes how the volcanic eruption changed the amount of atmospheric water vapor at Location 2: Darwin?
Choice 3 is right. On the Darwin graph the line of points reaches its farthest right, about 1000 parts per million by volume (ppmv), at about 27 km. Above and below that height the ratio is much smaller. A value of about 1000 ppmv is far above the usual 5 ppmv at this level, so the peak at 27 km is the water vapor added by the eruption.
The ratio does rise from about 23 km up to about 27 km, but above 27 km it falls back to 100 ppmv or less. So it did not keep increasing with altitude.
From about 23 km to about 27 km the ratio rises, not falls. Only above the peak at 27 km does it drop, so it did not keep decreasing with altitude.
The Darwin graph has no points at 22 km: its points start near the left edge at about 23 km. So 22 km is outside the Darwin observations shown, which is not the same as a measured low value there. This choice may come from reading a different location's graph, where the peak sits lower, such as Gove (about 23.5 km) or Willis Island (about 21 km).