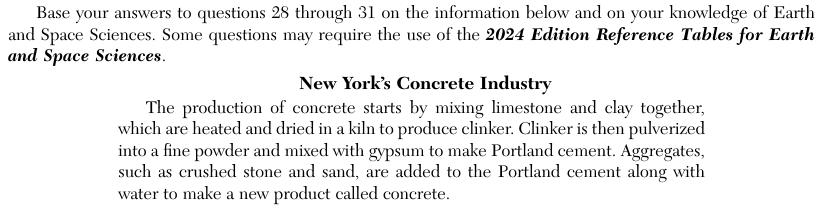
Earth and Space Sciences Regents, June 2026, question 29
Tap an image to open it full size.
What the figure shows
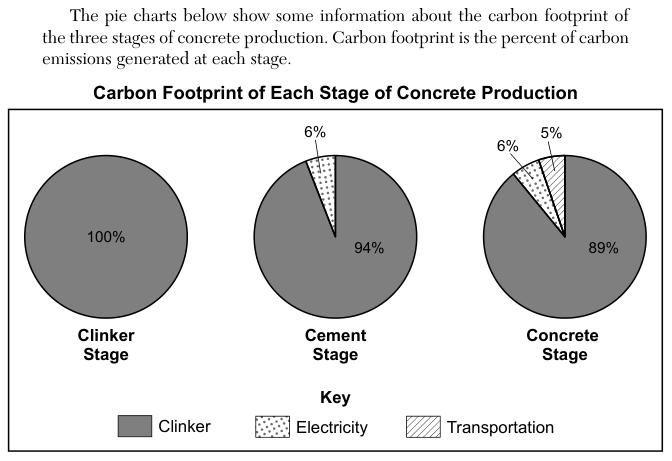
Three pie charts, titled Carbon Footprint of Each Stage of Concrete Production, show the percent of carbon emissions from each source at each stage. Clinker Stage: clinker 100%. Cement Stage: clinker 94%, electricity 6%. Concrete Stage: clinker 89%, electricity 6%, transportation 5%. The passage says clinker is made by heating limestone and clay in a kiln.
How to think about it
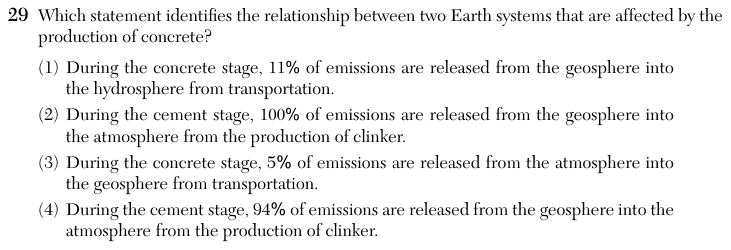
Each choice names a stage, a percent, a source, and a direction of movement between two Earth systems. Read the percent for that source from the matching pie chart. Then think about where the carbon in the source starts and where the emissions go.
Which statement identifies the relationship between two Earth systems that are affected by the production of concrete?
Choice 4 is right. The Cement Stage pie chart shows that 94% of the emissions come from clinker. Clinker is made by heating limestone, a rock from the geosphere, and this releases carbon dioxide gas into the atmosphere.
In the Concrete Stage chart, transportation is 5%, not 11%. The 11% may come from adding the electricity (6%) and transportation (5%) slices. Carbon emissions are gases that go into the atmosphere, not the hydrosphere.
100% is the value in the Clinker Stage chart, not the Cement Stage chart. In the cement stage, clinker gives 94% of the emissions and electricity gives the other 6%.
The 5% for transportation in the Concrete Stage chart is correct, but the direction is reversed. Burning fuel for transportation releases carbon into the atmosphere. It does not move carbon from the atmosphere into the geosphere.