Earth and Space Sciences Regents, June 2026, question 16
Tap an image to open it full size.
What the figure shows
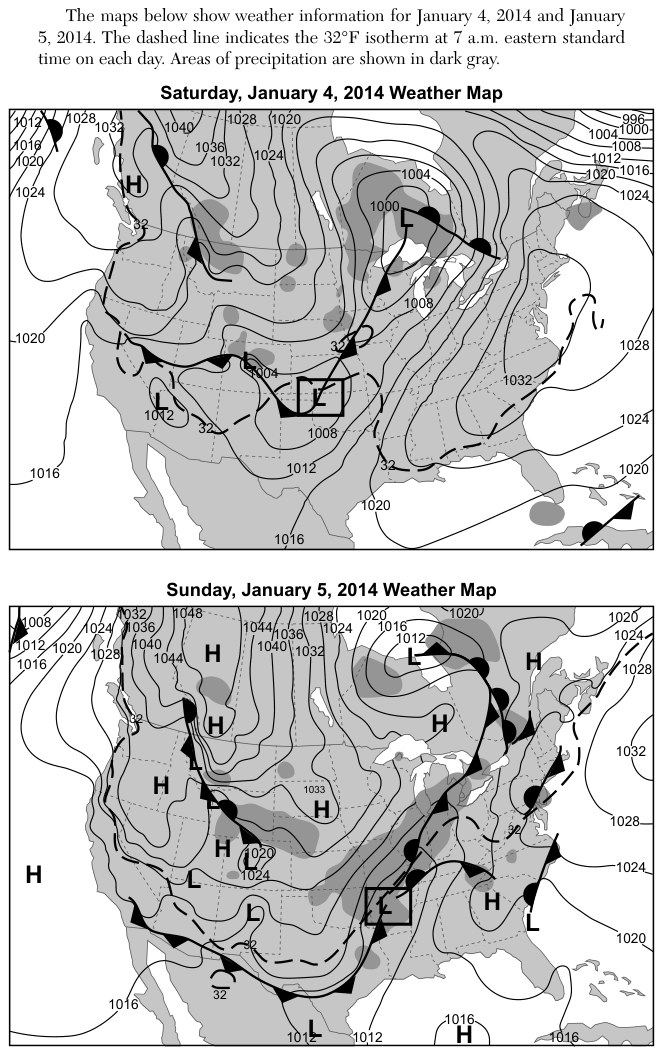
Two weather maps of North America show isobars labelled in millibars (mb), fronts, high pressure (H) and low pressure (L) centers, a dashed 32 degrees Fahrenheit (°F) isotherm at 7 a.m. eastern standard time, and areas of precipitation in dark gray. North is toward the top of each map. On the Saturday, January 4, 2014 map, a box marks an L in the southern Great Plains of the United States, at the southern end of a cold front, near the 1008 mb isobar. On the Sunday, January 5, 2014 map, a box marks an L in the south-central United States, near the lower Ohio and Mississippi valleys, where a cold front and a warm front meet; a band of dark gray precipitation runs from the box northeast toward the Great Lakes.
How to think about it
Find the boxed L on each map and compare where it sits, using north at the top of the map and east to the right. Then look at the shading in and around the box on the second map. The Key to Weather Map Symbols on page 18 explains the front and pressure symbols.
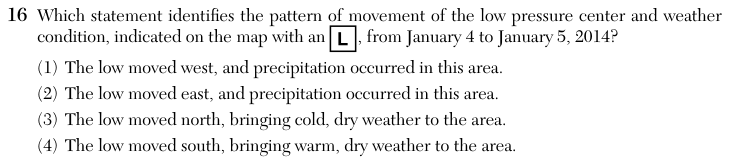
Which statement identifies the pattern of movement of the low pressure center and weather condition, indicated on the map with an , from January 4 to January 5, 2014?
Reference table: Key to Weather Map Symbols (2024 edition, page 18)