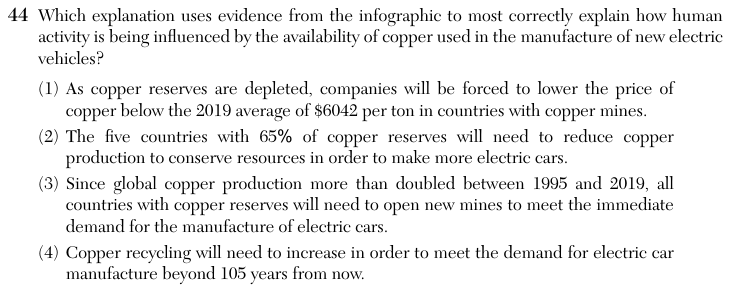
Earth and Space Sciences Regents, January 2026, question 44
Tap an image to open it full size.
What the figure shows
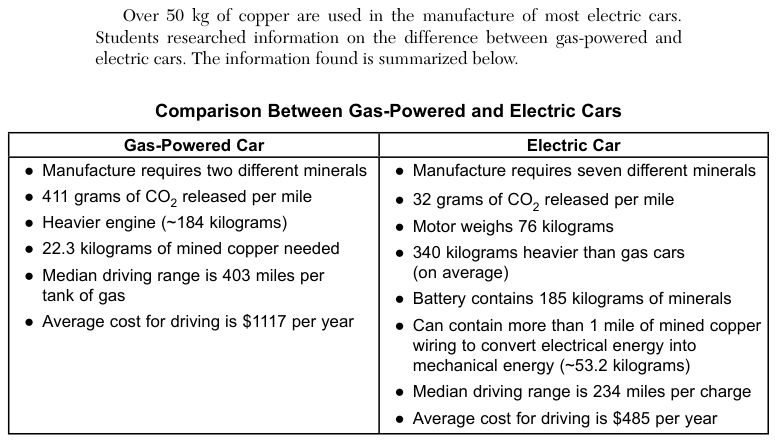
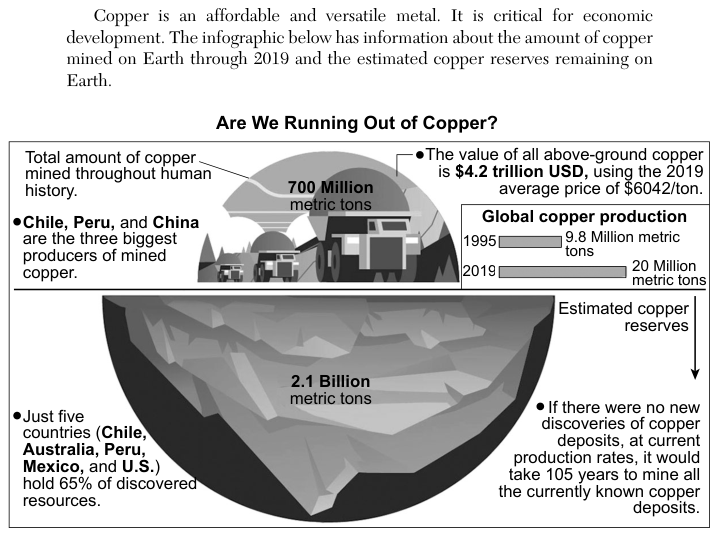
The infographic Are We Running Out of Copper? says 700 million metric tons of copper have been mined in all of human history, and that the value of all above-ground copper is $4.2 trillion United States dollars (USD), using the 2019 average price of $6042 per ton. Chile, Peru and China are the three biggest producers of mined copper. Global copper production was 9.8 million metric tons in 1995 and 20 million metric tons in 2019. Estimated copper reserves are 2.1 billion metric tons, and five countries (Chile, Australia, Peru, Mexico and the United States) hold 65% of discovered resources. It states: "If there were no new discoveries of copper deposits, at current production rates, it would take 105 years to mine all the currently known copper deposits." Other context says most electric cars use over 50 kilograms of copper.
How to think about it
Read each statement and find the number it quotes in the infographic. Check two things: that the number is used the way the infographic uses it, and that the conclusion follows from it. Ask what happens to a supply that is limited when the demand for it keeps growing.
Which explanation uses evidence from the infographic to most correctly explain how human activity is being influenced by the availability of copper used in the manufacture of new electric vehicles?
Choice 4 is right. The infographic says that, with no new discoveries and at current production rates, the known copper deposits would all be mined in about 105 years. Electric cars need over 50 kilograms of copper each, so demand will continue after that. The infographic counts 700 million metric tons of copper mined in all of human history. Not all of it can be recovered, but recovering and recycling the copper that is still accessible can help meet that demand.
When a resource becomes scarce, its price tends to rise, not fall. The infographic gives the 2019 price only to value above-ground copper; it says nothing about prices being forced down.
Reducing copper production would leave less copper for making electric cars, so this choice works against its own goal. The 65% figure tells where the reserves are, not that those countries plan to cut production.
Production did roughly double, from 9.8 to 20 million metric tons, but the infographic gives no evidence that every country with reserves must open new mines now. This choice may come from stretching a true number into a conclusion the data do not support.