Earth and Space Sciences Regents, January 2026, question 30
Tap an image to open it full size.
What the figure shows
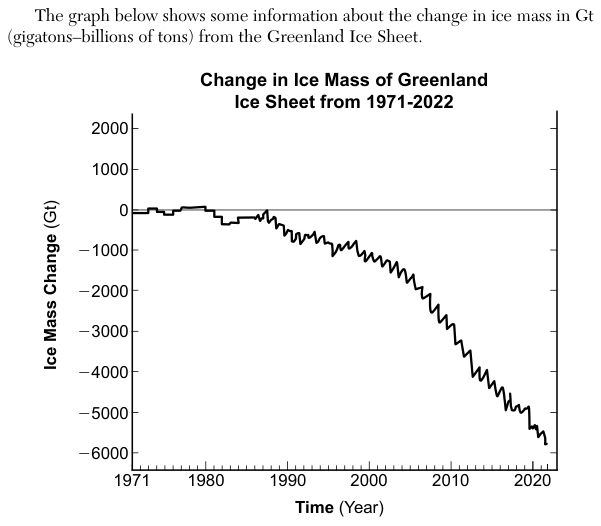
The graph, Change in Ice Mass of Greenland Ice Sheet from 1971-2022, plots ice mass change in gigatons (Gt, billions of tons) against time in years. The line stays near 0 Gt until about 1985, then falls. It reaches about -1000 Gt near 2000 and about -5800 Gt in 2022, falling more steeply after about 2000.
How to think about it
A rate of change is the change in an amount divided by the time it took. Read the ice mass change on the graph at 2010 and at 2022, find the difference, and divide by the number of years between them. Check that the unit of the answer is a rate (an amount per year), not a total amount.
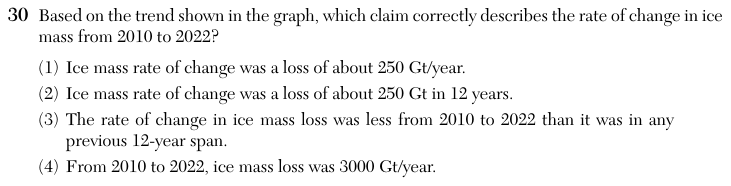
Based on the trend shown in the graph, which claim correctly describes the rate of change in ice mass from 2010 to 2022?
Choice 1 is right. The graph reads about -2900 Gt in 2010 and about -5800 Gt in 2022, a loss of about 2900 to 3000 Gt over 12 years. Dividing by 12 years gives a loss of about 250 gigatons per year (Gt/year).
250 Gt is the loss in one year, not in 12 years. Over the 12 years the total loss was about 3000 Gt. This choice may come from attaching the yearly rate to the whole time span.
The line is steeper from 2010 to 2022 than in earlier spans such as 1971 to 1983, when it stayed near 0 Gt. A steeper downward slope means faster loss, not slower loss.
About 3000 Gt is the total amount lost from 2010 to 2022, not the amount lost each year. A total amount and a rate per year are different quantities. This choice may come from forgetting to divide the total by the 12 years.