Earth and Space Sciences Regents, August 2025, question 47
Tap an image to open it full size.
What the figure shows
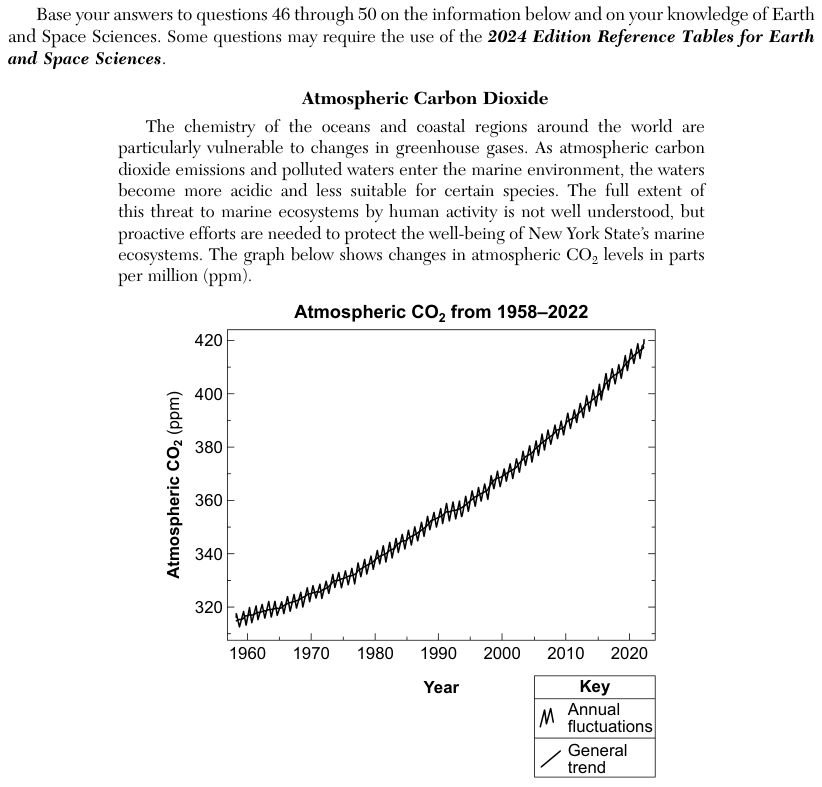
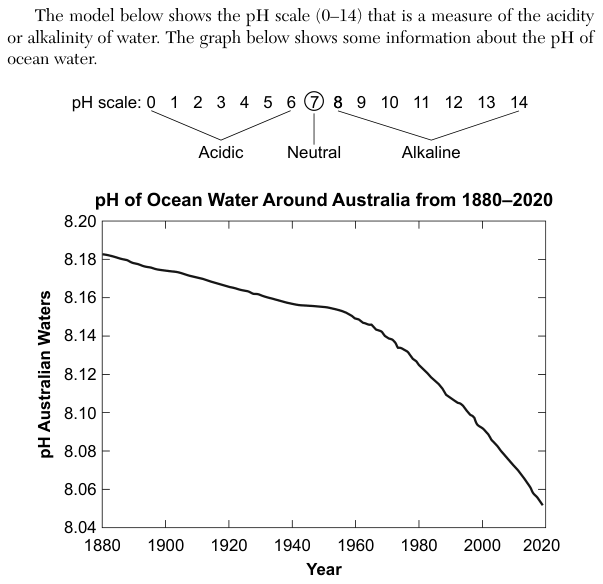
The graph Atmospheric CO2 from 1958-2022 shows atmospheric carbon dioxide (CO2) in parts per million (ppm), with annual fluctuations and a general trend that runs from about 315 ppm in 1958 to about 415 ppm in 2020. The passage says that as carbon dioxide enters the marine environment, the waters become more acidic. A pH scale model runs from 0 to 14, with 0 to 6 labeled acidic, 7 neutral and 8 to 14 alkaline. The graph pH of Ocean Water Around Australia from 1880-2020 shows a line from about 8.18 in 1880 to about 8.05 in 2020.
How to think about it
First read the direction of change on the carbon dioxide graph, then on the pH graph for the same years. Then find the ocean values on the pH scale model and see which way along the scale the change in pH moves them.
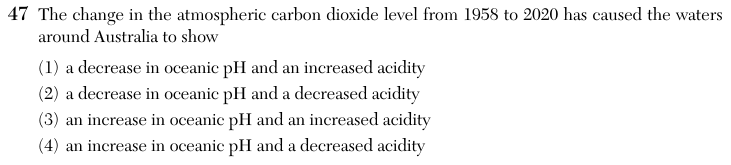
The change in the atmospheric carbon dioxide level from 1958 to 2020 has caused the waters around Australia to show
Choice 1 is right. Carbon dioxide rose from about 315 ppm in 1958 to about 415 ppm in 2020, and over the same years the pH of the water around Australia fell from about 8.15 to about 8.05. On the pH scale a lower number means more acidic. Carbon dioxide dissolving in seawater forms carbonic acid and releases hydrogen ions, which lowers the pH and raises the acidity.
The pH did decrease, but a lower pH means the water is more acidic, not less. This choice reverses the meaning of the pH scale.
The pH graph falls over these years, it does not rise. An increase in pH would also mean lower acidity, so the two parts of this choice cannot both be true at once.
An increase in pH with lower acidity would match a fall in carbon dioxide. The graphs show carbon dioxide rising and pH falling. This choice may come from reading the rising carbon dioxide graph as the pH graph.