Earth and Space Sciences Regents, June 2025, question 49
Tap an image to open it full size.
What the figure shows
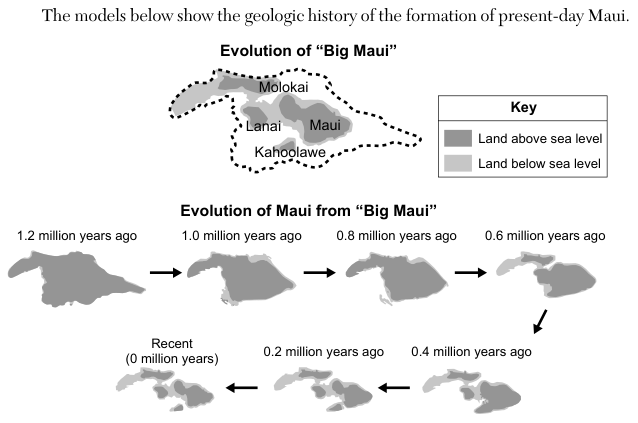
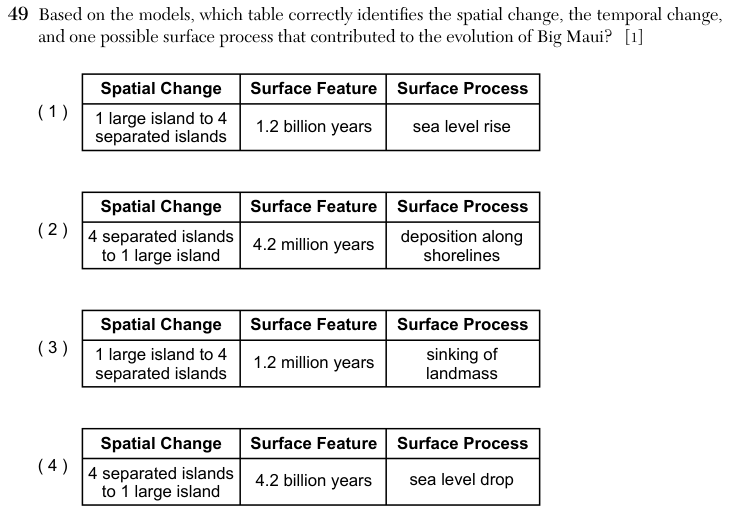
A map, Evolution of "Big Maui", shows a dashed outline around the present islands of Molokai, Lanai, Maui and Kahoolawe, with a key for land above sea level (dark) and land below sea level (light). A series of eight maps, Evolution of Maui from "Big Maui", runs from 1.2 million years ago through 1.0, 0.8, 0.6, 0.4 and 0.2 million years ago to Recent (0 million years). In the first map the land above sea level is one large piece; in the last map it is four separate islands, with light areas of land below sea level between them. Each answer choice is a three-column table headed Spatial Change, Surface Feature and Surface Process; the second column holds a length of time.
How to think about it
Compare the first and last maps of the series to see how the shape and number of land areas changed. Read the time labels for how long the change took, and check the units. Then think about which process would leave land that was once above sea level lying below it.
Based on the models, which table correctly identifies the spatial change, the temporal change, and one possible surface process that contributed to the evolution of Big Maui? [1]
Choice 3 is right. The maps show one large island 1.2 million years ago becoming four separate islands today, so the change took 1.2 million years. Areas that were once above sea level are now below it, which fits a landmass that has sunk. Volcanic islands sink as they move away from the hotspot, because their weight presses down on the crust beneath them.
The spatial change is correct, but the time is wrong by a factor of one thousand. The maps are labelled in millions of years, not billions, and the Hawaiian Islands are only a few million years old.
This reverses the change. The maps run from one large island to four separate islands, not the other way. The series also starts 1.2 million years ago, not 4.2 million, and deposition along shorelines would add land rather than separate the islands.
This reverses the change, and 4.2 billion years is close to the age of Earth itself, far longer than the 1.2 million years shown. A drop in sea level would join islands together, which is the opposite of what the maps show.