Earth and Space Sciences Regents, June 2025, question 48
Tap an image to open it full size.
What the figure shows
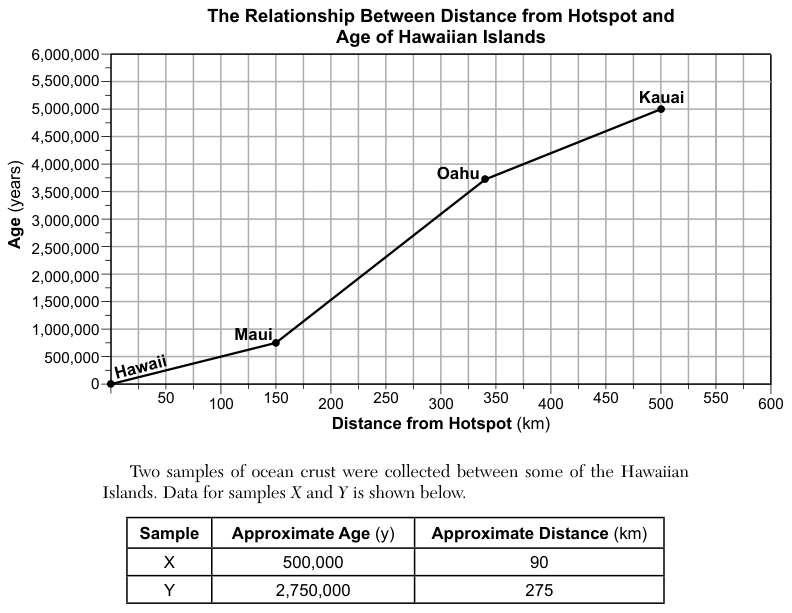
A line graph, The Relationship Between Distance from Hotspot and Age of Hawaiian Islands, plots age in years (0 to 6,000,000) against distance from the hotspot in kilometers (km) (0 to 600). The points are Hawaii at 0 km and 0 years, Maui at about 150 km and 750,000 years, Oahu at about 340 km and 3,700,000 years, and Kauai at 500 km and 5,000,000 years. A table gives two ocean crust samples collected between islands: sample X, about 500,000 years old at about 90 km; sample Y, about 2,750,000 years old at about 275 km.
How to think about it
Find each sample's distance on the horizontal axis and see which two island points it falls between. Check that its age also falls between the ages of those two islands.
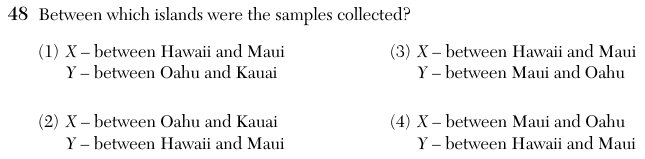
Between which islands were the samples collected?
Choice 3 is right. Sample X, at 90 kilometers and 500,000 years, lies between Hawaii (0 kilometers) and Maui (about 150 kilometers). Sample Y, at 275 kilometers and 2,750,000 years, lies between Maui (about 150 kilometers) and Oahu (about 340 kilometers). Both ages also fall between the ages of those islands.
Sample X is placed correctly, but sample Y at 275 kilometers is closer to the hotspot than Oahu (about 340 kilometers). It lies between Maui and Oahu, not between Oahu and Kauai.
Both samples are placed too far from the hotspot. Sample X at 90 kilometers is closer than Maui, and sample Y at 275 kilometers is closer than Oahu. This choice may come from reading the distance scale wrongly.
The samples are swapped. Sample X, the younger and closer sample, lies between Hawaii and Maui, and sample Y lies between Maui and Oahu.