Earth and Space Sciences Regents, June 2025, question 36
Tap an image to open it full size.
What the figure shows
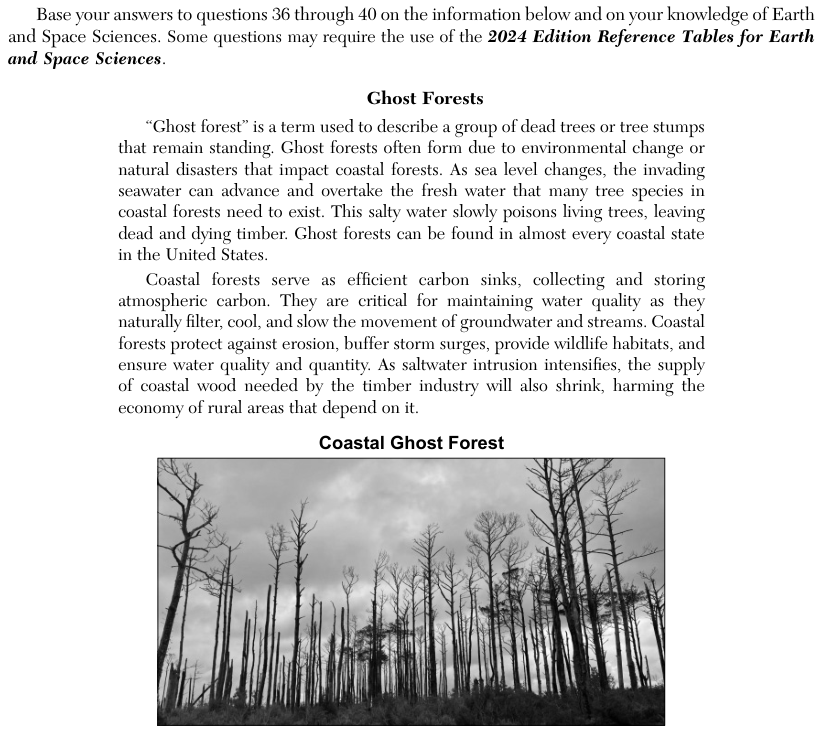
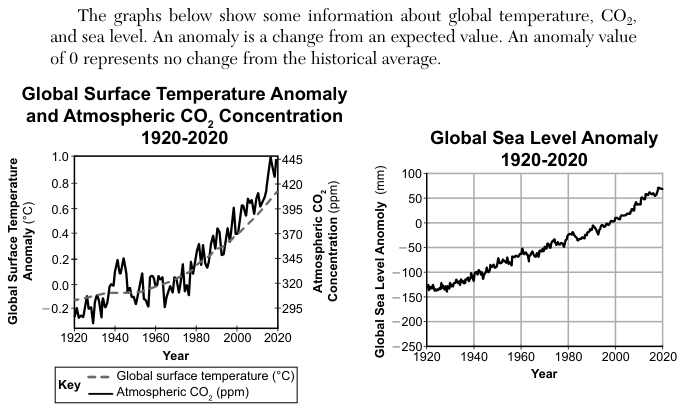
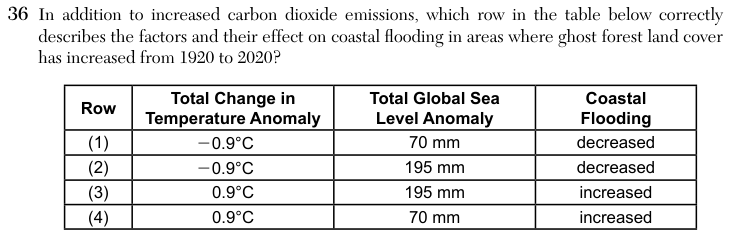
The passage explains that ghost forests form when invading seawater replaces the fresh water that coastal trees need. One graph, Global Surface Temperature Anomaly and Atmospheric CO2 Concentration 1920-2020, has the temperature anomaly in degrees Celsius (°C) on the left axis (dashed gray line) and atmospheric carbon dioxide (CO2) in parts per million (ppm) on the right axis (solid line). The dashed temperature line runs from about -0.1°C in 1920 to about 0.8°C in 2020. A second graph, Global Sea Level Anomaly 1920-2020, shows sea level in millimeters (mm), from about -130 mm in 1920 to about 65 mm in 2020. The passage defines an anomaly as a change from an expected value. The answer table has rows of temperature change, sea level change and coastal flooding.
How to think about it
The question asks for total change, so read each graph at 1920 and at 2020 and subtract the first value from the last. Use the key to pick the right line on the first graph: the dashed line is temperature. Then think about what a change in sea level does to low coastal land.
In addition to increased carbon dioxide emissions, which row in the table below correctly describes the factors and their effect on coastal flooding in areas where ghost forest land cover has increased from 1920 to 2020? Row Total Change in Temperature Anomaly Total Global Sea Level Anomaly Coastal Flooding