Earth and Space Sciences Regents, June 2025, question 34
Tap an image to open it full size.
What the figure shows
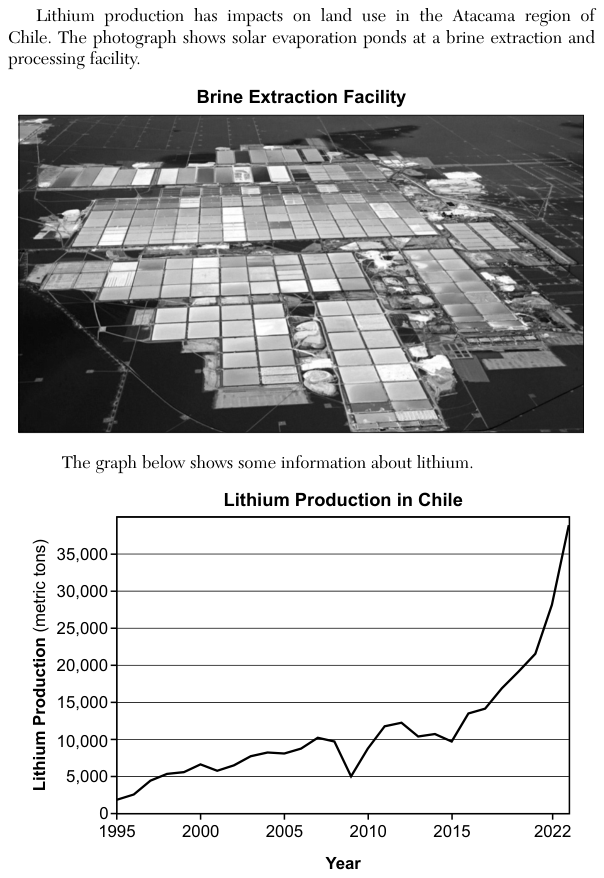
A photograph, Brine Extraction Facility, shows many rectangular solar evaporation ponds covering a large area in the Atacama region of Chile. A line graph, Lithium Production in Chile, plots lithium production in metric tons from 1995 to 2022. Production is about 2000 metric tons in 1995 and rises to about 10,000 by 2007. It drops to about 5000 in 2009, rises to about 12,000 by 2012, and is about 10,000 in 2015. After 2015 it rises steeply to about 39,000 in 2022.
How to think about it
For each statement, find the years it names on the graph and read the production values at those years. Check whether the line rises, falls or changes direction over that span. Then ask what the passage says the evaporation ponds are for.
Which statement correctly identifies the changes to the lithosphere that were needed for reservoir brine lithium extraction in Chile between 1995 and 2022?
Choice 3 is right. Production rose from about 10,000 metric tons in 2015 to about 39,000 in 2022, the steepest rise on the graph. The question treats lithium production as a stand-in for the area of evaporation ponds. On that basis, making more lithium by this method needs more ponds, so the land surface used for ponds increased over those years.
The line from 2005 to 2010 is not steady. It rises to about 10,000 metric tons in 2007, drops to about 5000 in 2009, and rises again. A consistent rate would be a straight, sloping line.
1995 is the lowest point, but 2015 is not the highest. Production in 2015 was about 10,000 metric tons, while 2022 reached about 39,000. This may come from stopping the reading partway along the time axis.
From 2010 to 2015 production went up and down. It rose to about 12,000 metric tons in 2012 before falling back, so it did not only decrease.