Earth and Space Sciences Regents, August 2026, question 49
Tap an image to open it full size.
What the figure shows
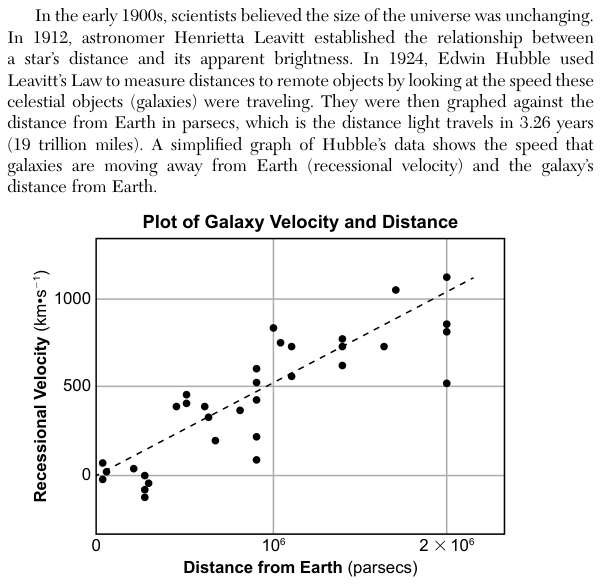
The passage says that in the early 1900s scientists believed the size of the universe was unchanging. In 1924 Edwin Hubble measured distances to galaxies and graphed the speed at which each galaxy moves away from Earth (recessional velocity) against its distance from Earth. The graph, Plot of Galaxy Velocity and Distance, has distance from Earth in parsecs on the horizontal axis (0 to beyond 2 × 10^6) and recessional velocity in kilometers per second (km/s) on the vertical axis (about -100 to 1100). It shows about 30 dots and a dashed straight line that rises from near 0 at the left to about 1100 km/s at the right.
How to think about it
Look at the trend of the dashed line on the graph: as you move to the right along the distance axis, follow what happens to the velocity. Then read each statement and check whether it describes that trend.
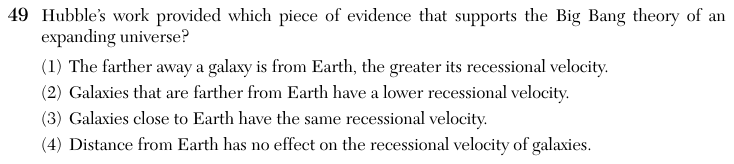
Hubble’s work provided which piece of evidence that supports the Big Bang theory of an expanding universe?
Choice 1 is right. The dashed line on Hubble's graph rises from left to right, so galaxies farther from Earth move away faster. This pattern is what an expanding universe produces: if all of space is stretching, the distance to a far galaxy grows faster than the distance to a near one. This relationship is evidence for the Big Bang theory.
This reverses the trend. The dashed line rises, so a greater distance goes with a higher recessional velocity, not a lower one. The error may come from reading the graph from right to left.
The galaxies near Earth on the left of the graph have different velocities, some slightly below 0 and some above. They do not share one velocity. The pattern on the graph is a change of velocity with distance.
The graph shows a clear rising trend between distance and recessional velocity. Saying distance has no effect may come from looking at the scatter of single dots instead of the dashed line that fits all of them.