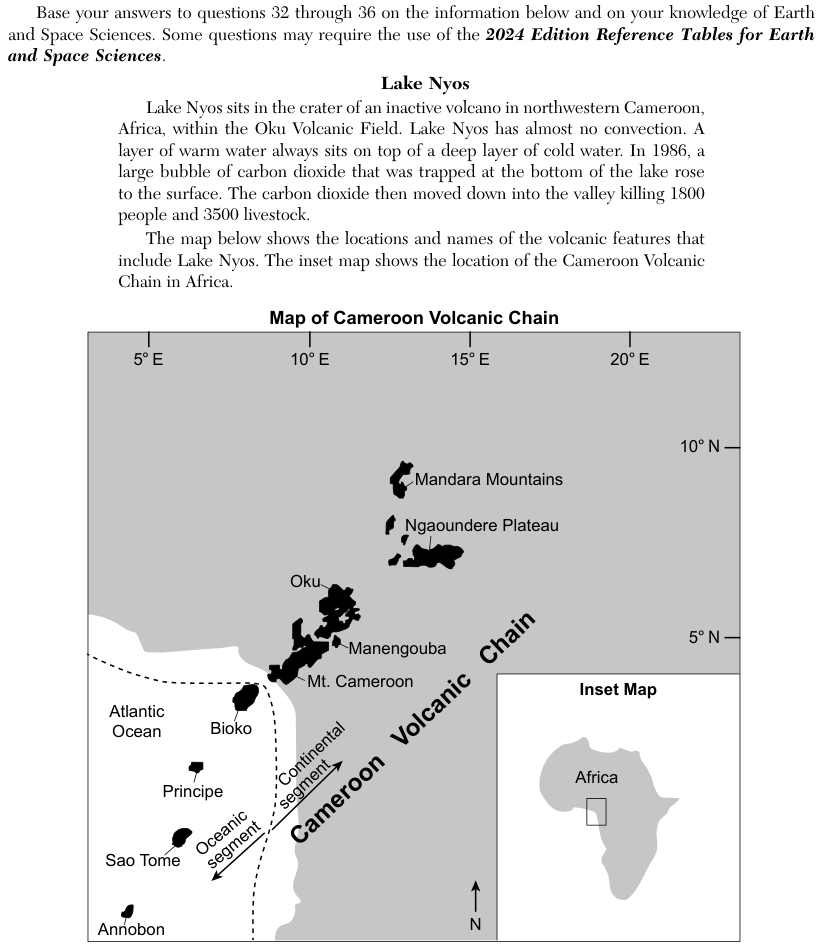
Earth and Space Sciences Regents, June 2026, question 33
Tap an image to open it full size.
What the figure shows
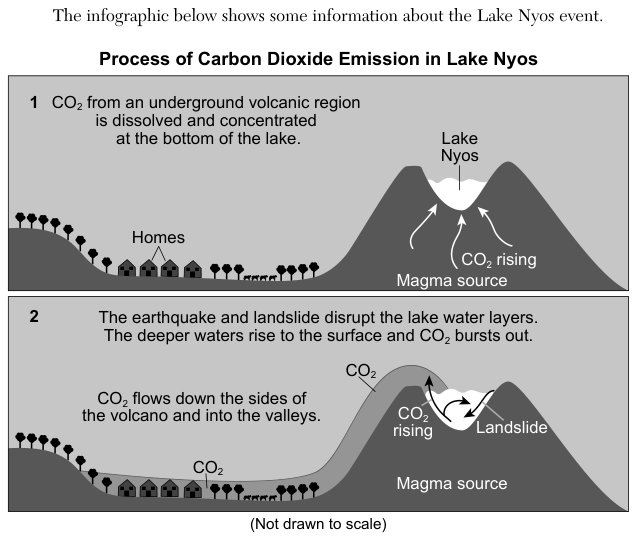
The infographic, Process of Carbon Dioxide Emission in Lake Nyos, has two panels. Panel 1 shows carbon dioxide (CO2) from an underground volcanic region (a magma source) dissolved and concentrated at the bottom of the lake, which sits high in a volcanic crater, with homes, trees and livestock on the valley floor below. Panel 2 shows an earthquake and landslide disrupting the lake water layers, CO2 bursting out, and a layer of CO2 flowing down the sides of the volcano and into the valleys, covering the homes on the valley floor. The passage says the 1986 release killed 1800 people and 3500 livestock.
How to think about it
Look at both panels of the infographic. Note where the carbon dioxide comes from, where it goes after it leaves the lake, and where the homes are. Then compare each response with what the two panels show.
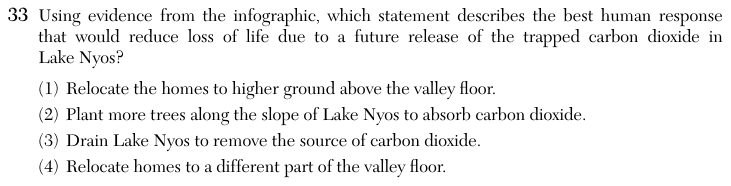
Using evidence from the infographic, which statement describes the best human response that would reduce loss of life due to a future release of the trapped carbon dioxide in Lake Nyos?
Choice 1 is right. Panel 2 shows the carbon dioxide flowing downhill and collecting as a layer over the valley floor. Homes on higher ground, above the valley floor, would be above that layer, so people living there would be much less likely to breathe the gas.
Trees take in carbon dioxide slowly, over seasons and years. They cannot remove a sudden release of a very large amount of gas in time to protect people. This choice may come from knowing that plants take in carbon dioxide without comparing how fast they do it with how fast the gas is released.
Draining a large crater lake would be much harder and more disruptive than moving homes to higher ground. Lowering the water would also reduce the pressure on the deep water, so carbon dioxide already dissolved in it could come out, and that gas would have to be handled safely. This choice may come from reading the lake water, which holds the gas, as the place the gas comes from.
Panel 2 shows the carbon dioxide spreading along the valley floor. Moving homes to another part of the same low valley floor would leave people inside the area the gas fills. This choice may come from thinking about moving the homes without checking where panel 2 shows the gas collecting.