Earth and Space Sciences Regents, August 2025, question 36
Tap an image to open it full size.
What the figure shows
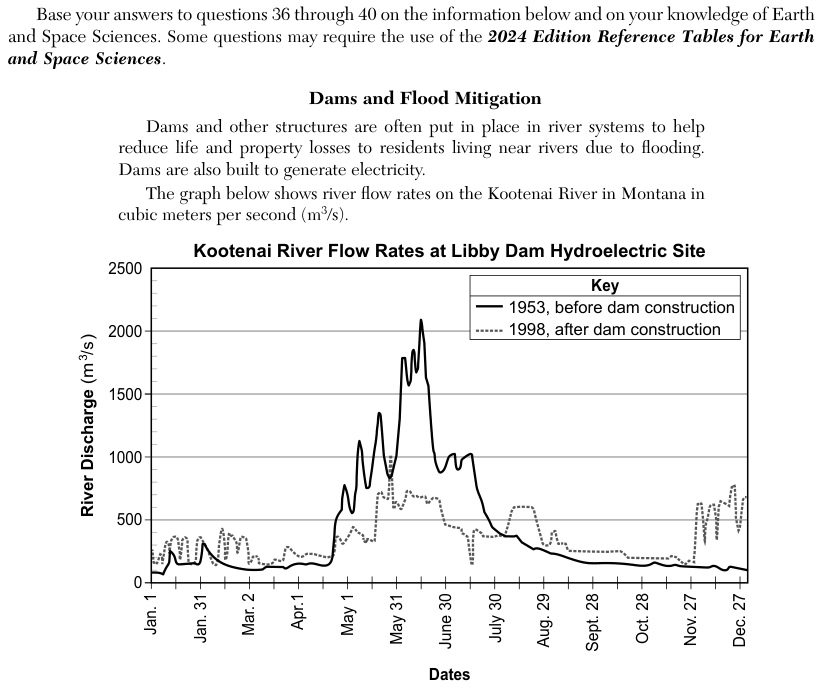
The passage says that dams are built to reduce losses from flooding and to generate electricity. A graph, Kootenai River Flow Rates at Libby Dam Hydroelectric Site, plots river discharge in cubic meters per second (m3/s) from January 1 to December 27. A solid line shows 1953, before dam construction. It stays below about 350 from January to April, rises to peaks near 2000 in late May and early June, and falls to about 150 through autumn. A dotted line shows 1998, after dam construction. It stays mostly between about 150 and 750 all year, with its highest values near 1000 in late May and values of about 500 to 750 in November and December.
How to think about it
Compare the two lines across the whole year, not one month. Look at how high the highest flow and how low the lowest flow are on each line. Then think about why a power company would want the amount of water reaching its turbines to be easier to predict.
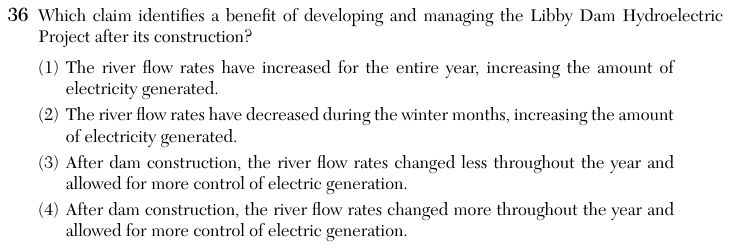
Which claim identifies a benefit of developing and managing the Libby Dam Hydroelectric Project after its construction?
Choice 3 is right. Before the dam, flow ranged from below 100 to about 2000 m3/s in a single year. After the dam, flow stayed between about 150 and 1000 m3/s. The dam stores water in spring and releases it later, so the flow changes less. A steadier flow lets the operators plan and control how much electricity they generate.
Flow did not increase all year. In late May and June the 1998 flow is far lower than the 1953 flow, because the dam holds back the spring water in its reservoir.
The winter flow increased, not decreased. In November, December and January the dotted 1998 line is above the solid 1953 line. This choice may come from reading the two lines in the key the wrong way round.
This reverses what the graph shows. The 1953 line has a very high spring peak and low flow the rest of the year, while the 1998 line stays within a much narrower range. Flow changed less after the dam, not more.