Earth and Space Sciences Regents, June 2025, question 42
Tap an image to open it full size.
What the figure shows
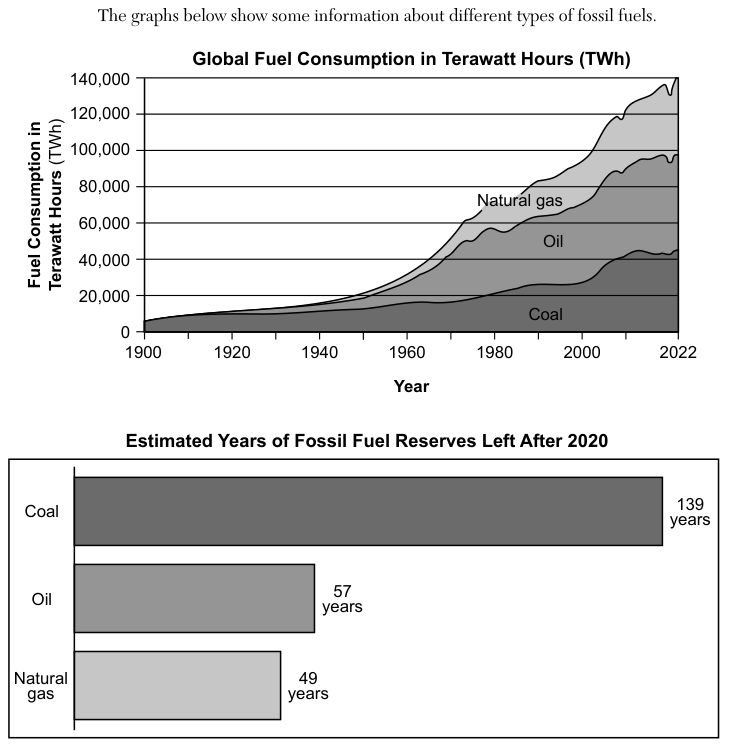
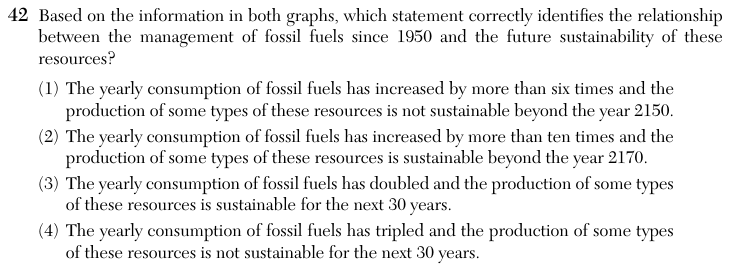
The first graph, Global Fuel Consumption in Terawatt Hours (TWh), is a stacked area graph from 1900 to 2022. It shows coal at the bottom, oil in the middle and natural gas on top; the top line gives total fossil fuel use, on a vertical axis from 0 to 140,000 TWh. The second graph, Estimated Years of Fossil Fuel Reserves Left After 2020, is a bar graph: coal 139 years, oil 57 years and natural gas 49 years.
How to think about it
Each statement makes two claims, and both must match the graphs. First read the total consumption in 1950 and in 2022 from the top line of the first graph, and divide the later value by the earlier one. Then add each reserve figure to 2020 to find the year when that fuel is expected to run out, and compare those years with the years named in the statements.
Based on the information in both graphs, which statement correctly identifies the relationship between the management of fossil fuels since 1950 and the future sustainability of these resources?
Choice 1 is right. Total fossil fuel use was about 20,000 terawatt hours in 1950 and about 140,000 terawatt hours in 2022, about seven times as much, so it has increased by more than six times. Natural gas reserves are expected to run out around 2069 (2020 + 49), oil around 2077 (2020 + 57) and coal around 2159 (2020 + 139). Oil and natural gas will not last to 2150, so some types are not sustainable beyond 2150.
Consumption grew about seven times, not more than ten times. Also, no fuel lasts beyond 2170: even coal, with 139 years left after 2020, is expected to run out around 2159. This choice may come from reading the 1950 total too low.
Consumption did not double; it grew about seven times. The second part is true, since every fuel lasts at least 49 years after 2020, but the first part does not match the graph. This choice may come from comparing the wrong years on the first graph.
Consumption grew about seven times, not three times. Also, every fuel has at least 49 years of reserves left after 2020, so all three types are expected to last longer than the next 30 years.