Earth and Space Sciences Regents, June 2025, question 22
Tap an image to open it full size.
What the figure shows
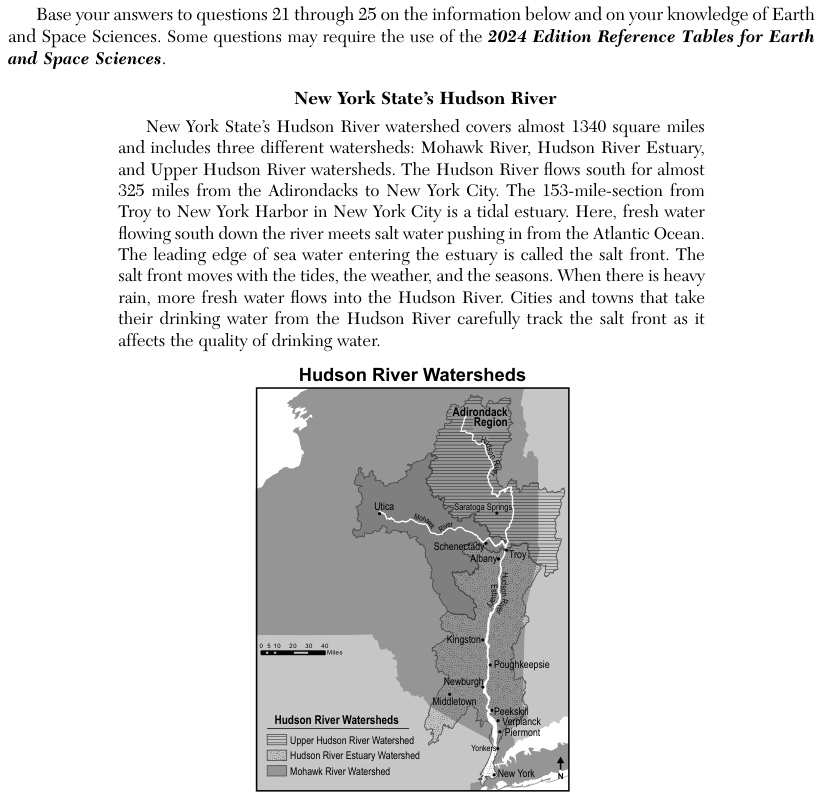
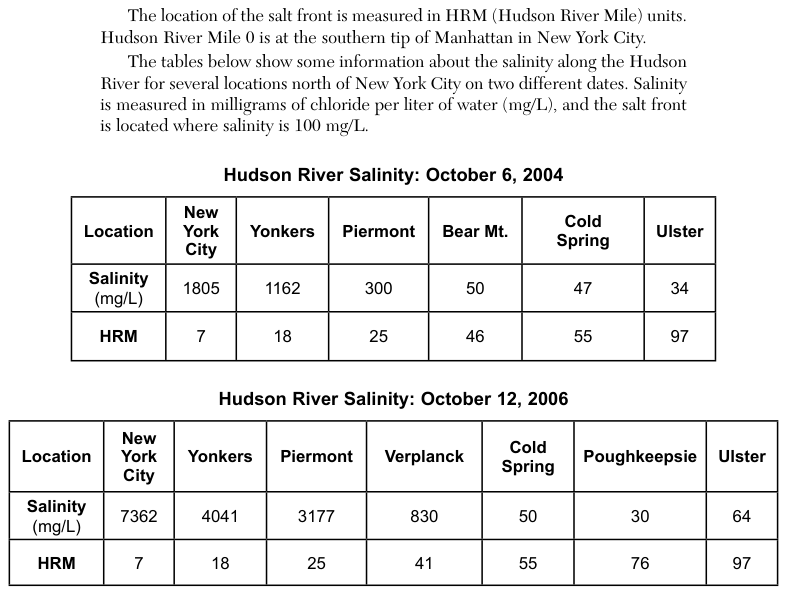
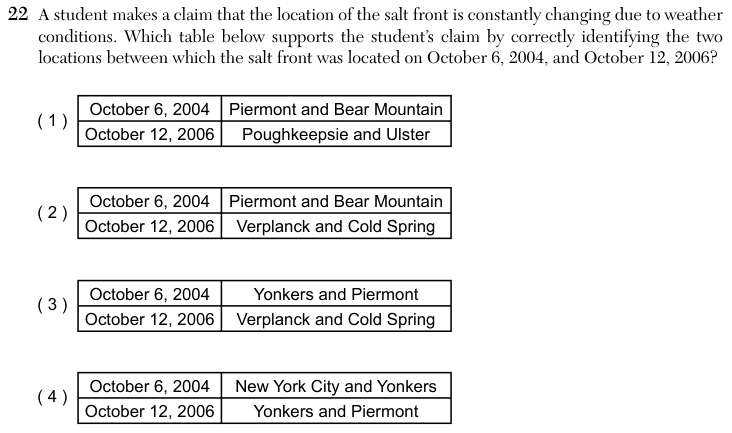
A map shows the Hudson River flowing south from the Adirondack region to New York City, with towns along its banks. Two tables give salinity in milligrams of chloride per liter of water (mg/L) and the position in Hudson River Miles (HRM), counted north from the southern tip of Manhattan, for towns on October 6, 2004, and October 12, 2006. The passage states that the salt front is where salinity equals 100 mg/L. Each answer choice is a small table naming two towns for each date.
How to think about it
Treat each date on its own. Read the salinity row from south to north and find the two neighbouring towns where the value changes from above 100 milligrams per liter to below it. The salt front lies between those two towns.
A student makes a claim that the location of the salt front is constantly changing due to weather conditions. Which table below supports the student’s claim by correctly identifying the two locations between which the salt front was located on October 6, 2004, and October 12, 2006? October 6, 2004 Piermont and Bear Mountain Poughkeepsie and Ulster October 12, 2006